Fig. 7.
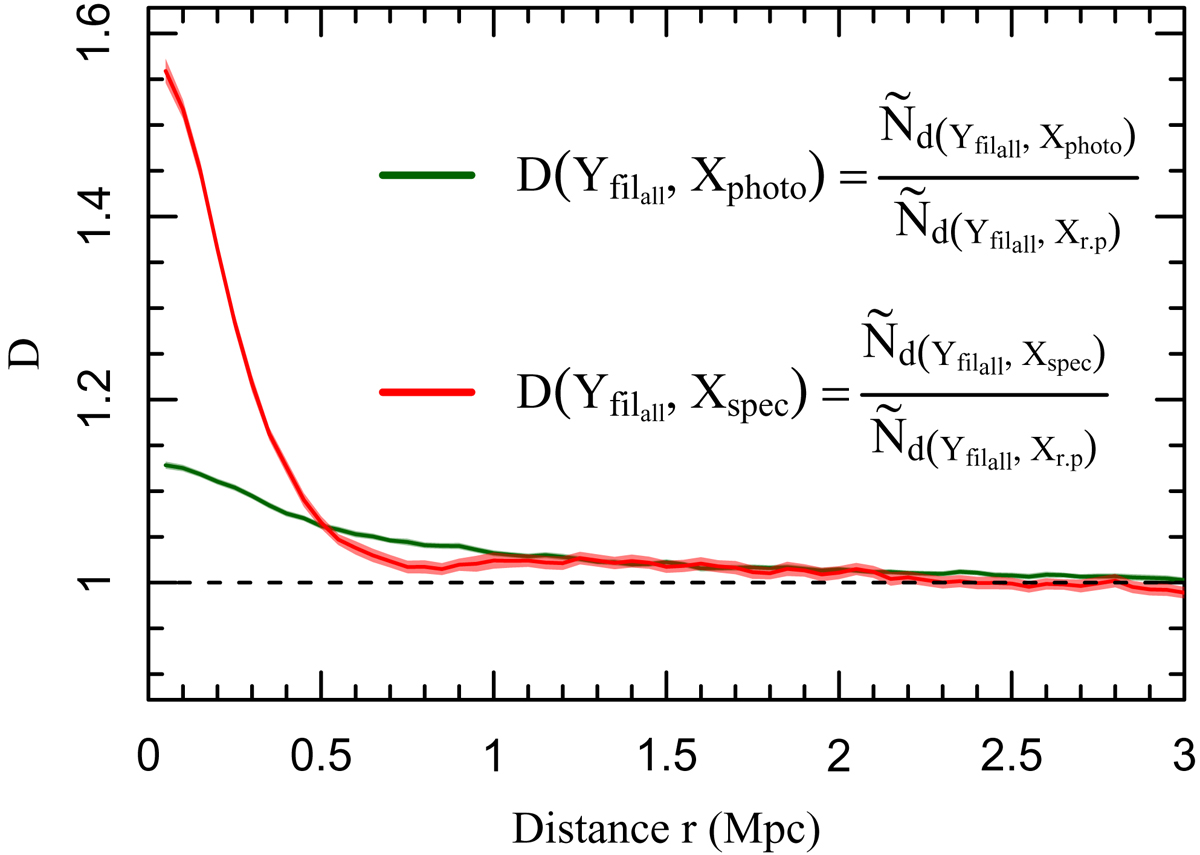
The y-axis is the quotient D dependent on the distance r, which is described by the x-axis. See Sect. 3.4 for a detailed description of D. The dark green line draws the quotient of distances from filamentary spines to photometric galaxy lines of sight and to lines of sight that are distributed randomly. The red line draws the quotient of distances from the filamentary spines to spectroscopic galaxy lines of sight and to lines of sight that are distributed randomly. The shaded areas surrounding the lines denote the calculated 0.95 confidence intervals.
Current usage metrics show cumulative count of Article Views (full-text article views including HTML views, PDF and ePub downloads, according to the available data) and Abstracts Views on Vision4Press platform.
Data correspond to usage on the plateform after 2015. The current usage metrics is available 48-96 hours after online publication and is updated daily on week days.
Initial download of the metrics may take a while.