Fig. 3.
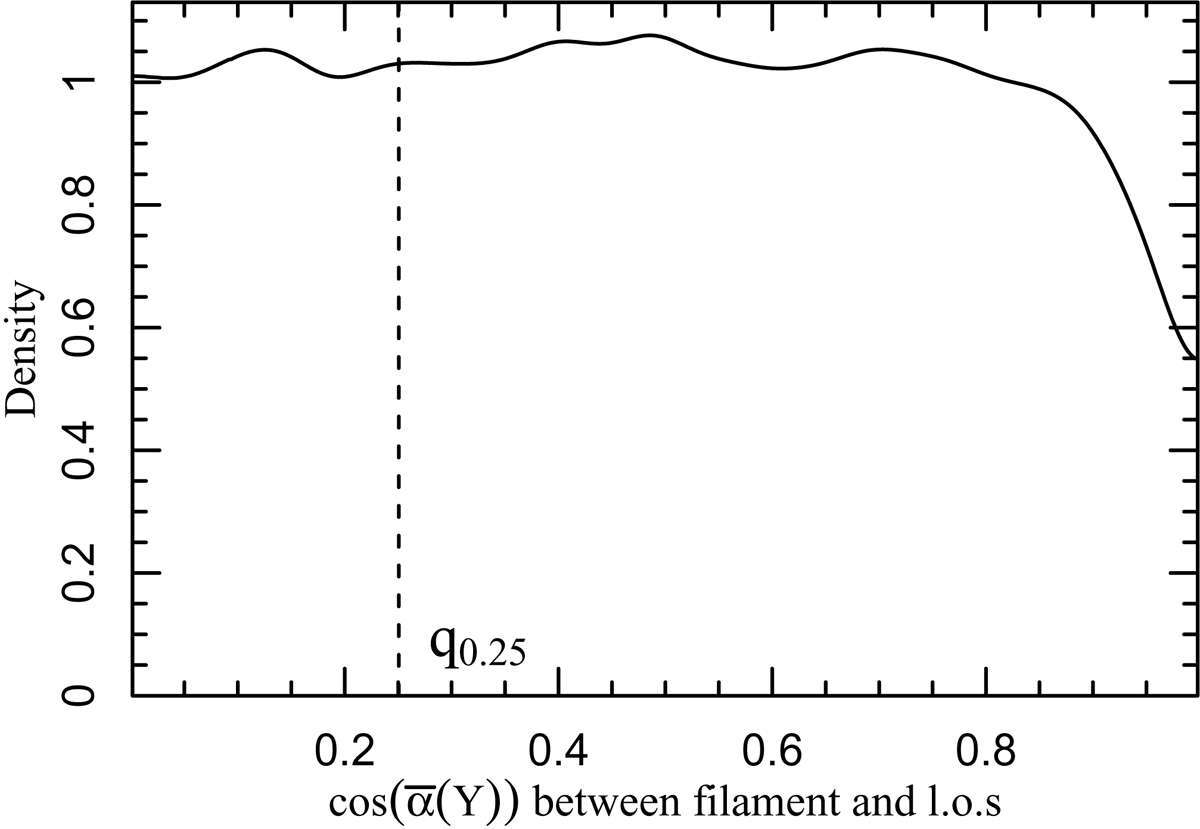
Smoothed density distribution of the cosine of the mean orientation of spines ![]() of the filamentary spines whose average distance is in the range from 200 Mpc to 800 Mpc. The dashed black line denotes the q0.25 quantile of the density distribution, which is used to select subsamples of filaments that are perpendicular to the line of sight.
of the filamentary spines whose average distance is in the range from 200 Mpc to 800 Mpc. The dashed black line denotes the q0.25 quantile of the density distribution, which is used to select subsamples of filaments that are perpendicular to the line of sight.
Current usage metrics show cumulative count of Article Views (full-text article views including HTML views, PDF and ePub downloads, according to the available data) and Abstracts Views on Vision4Press platform.
Data correspond to usage on the plateform after 2015. The current usage metrics is available 48-96 hours after online publication and is updated daily on week days.
Initial download of the metrics may take a while.