Fig. 1.
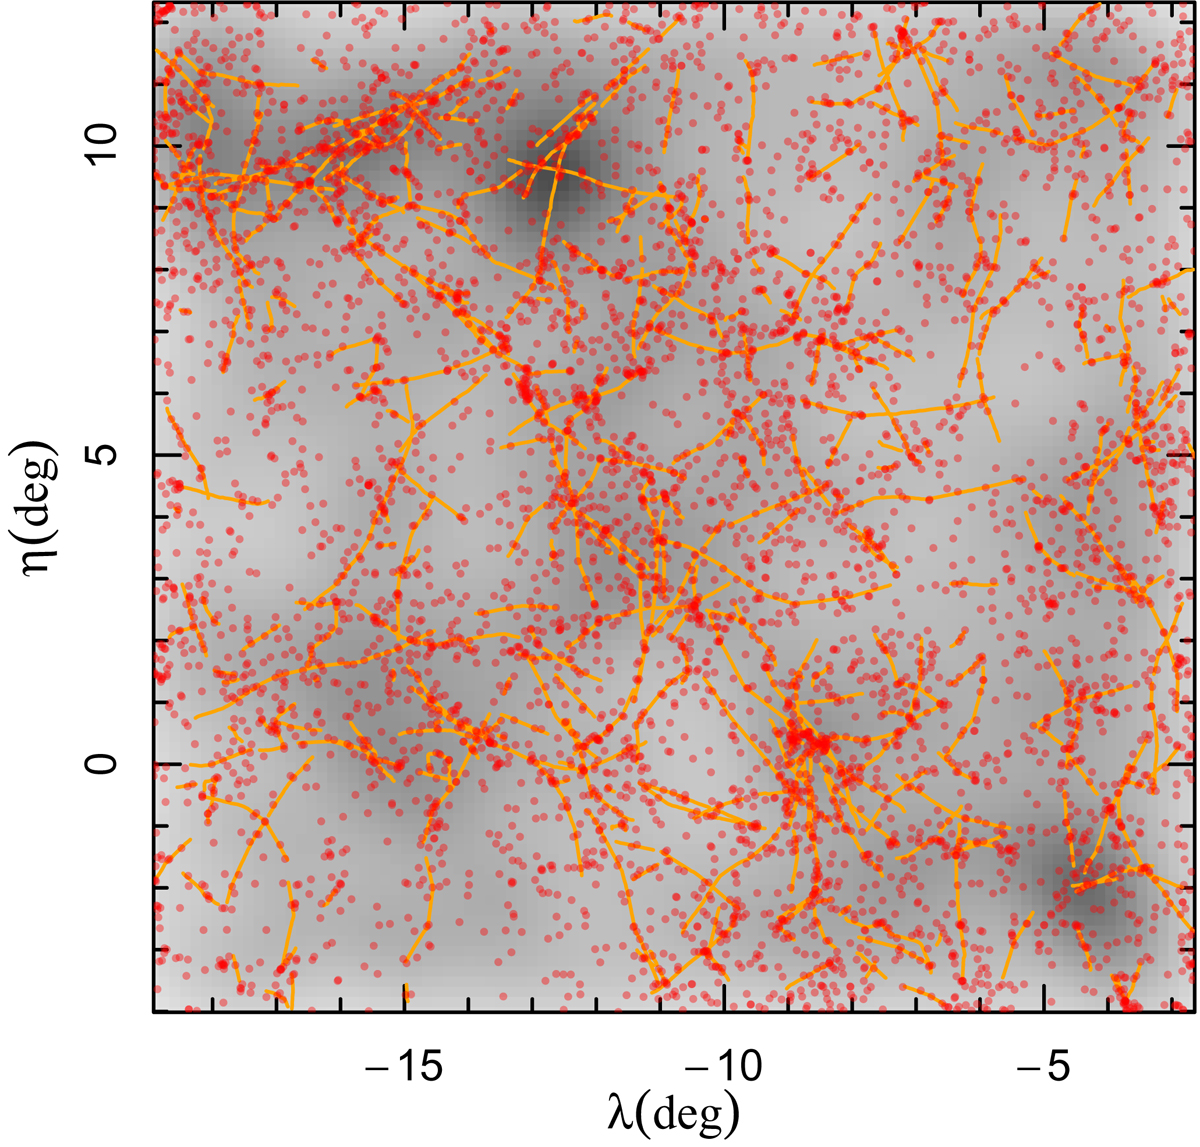
Visualisation of the datasets in spherical sky-coordinates: kernel-smoothed 2-dimensional density from the distribution of photometric galaxies on the viewed region of the sphere (grey background density), filamentary spines (orange spines), and spectroscopic galaxies (red dots). Darker grey denotes a higher density of photometric galaxies. All the drawn objects are located in the distance range of 400 − 600 Mpc.
Current usage metrics show cumulative count of Article Views (full-text article views including HTML views, PDF and ePub downloads, according to the available data) and Abstracts Views on Vision4Press platform.
Data correspond to usage on the plateform after 2015. The current usage metrics is available 48-96 hours after online publication and is updated daily on week days.
Initial download of the metrics may take a while.