Free Access
Fig. 6.
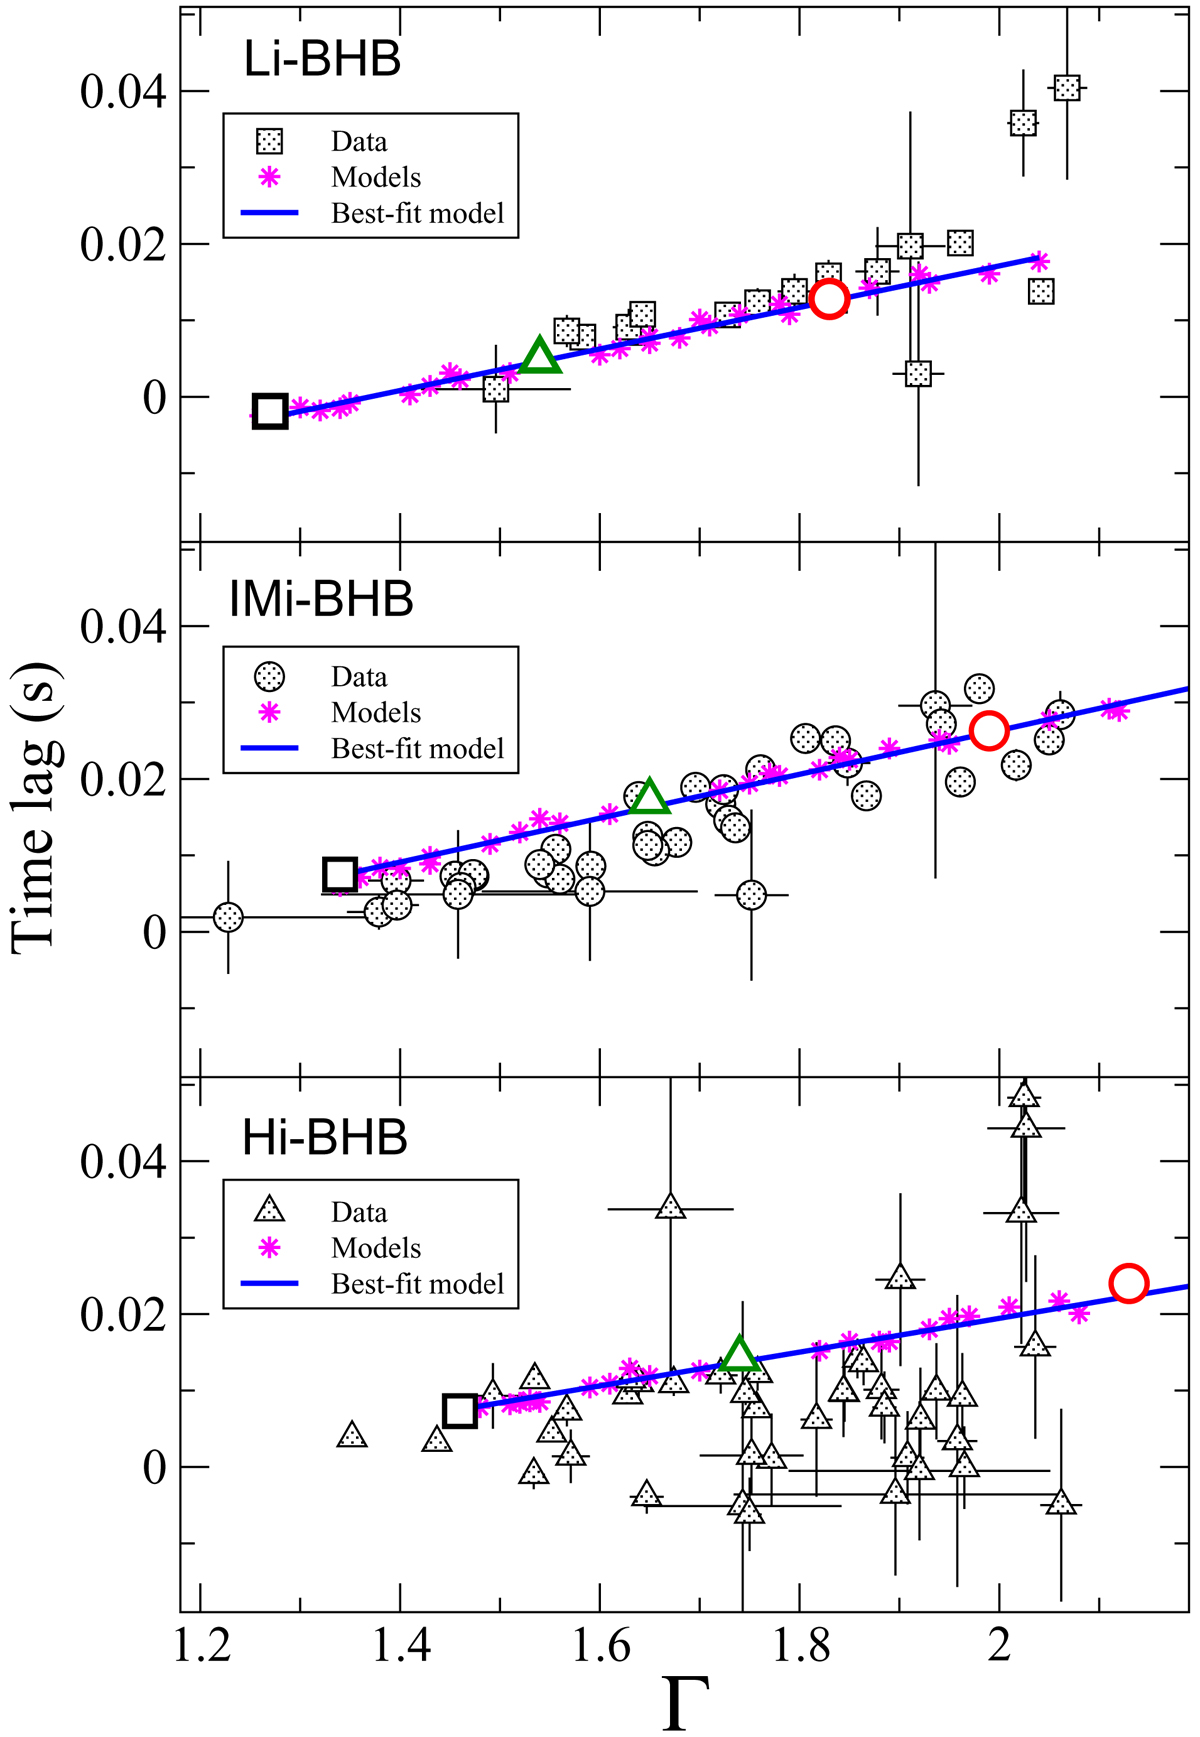
Comparison of data (dot-filled symbols) and models (magenta stars). The lines represent the best linear fit to the models. The three larger symbols correspond to three representative models: τ∥ = 10 and R0 = 50rg (square), one with τ∥ = 5 and R0 = 140rg (triangle), and one with τ∥ = 2.75 and R0 = 250rg (circle).
Current usage metrics show cumulative count of Article Views (full-text article views including HTML views, PDF and ePub downloads, according to the available data) and Abstracts Views on Vision4Press platform.
Data correspond to usage on the plateform after 2015. The current usage metrics is available 48-96 hours after online publication and is updated daily on week days.
Initial download of the metrics may take a while.