Free Access
Fig. 5.
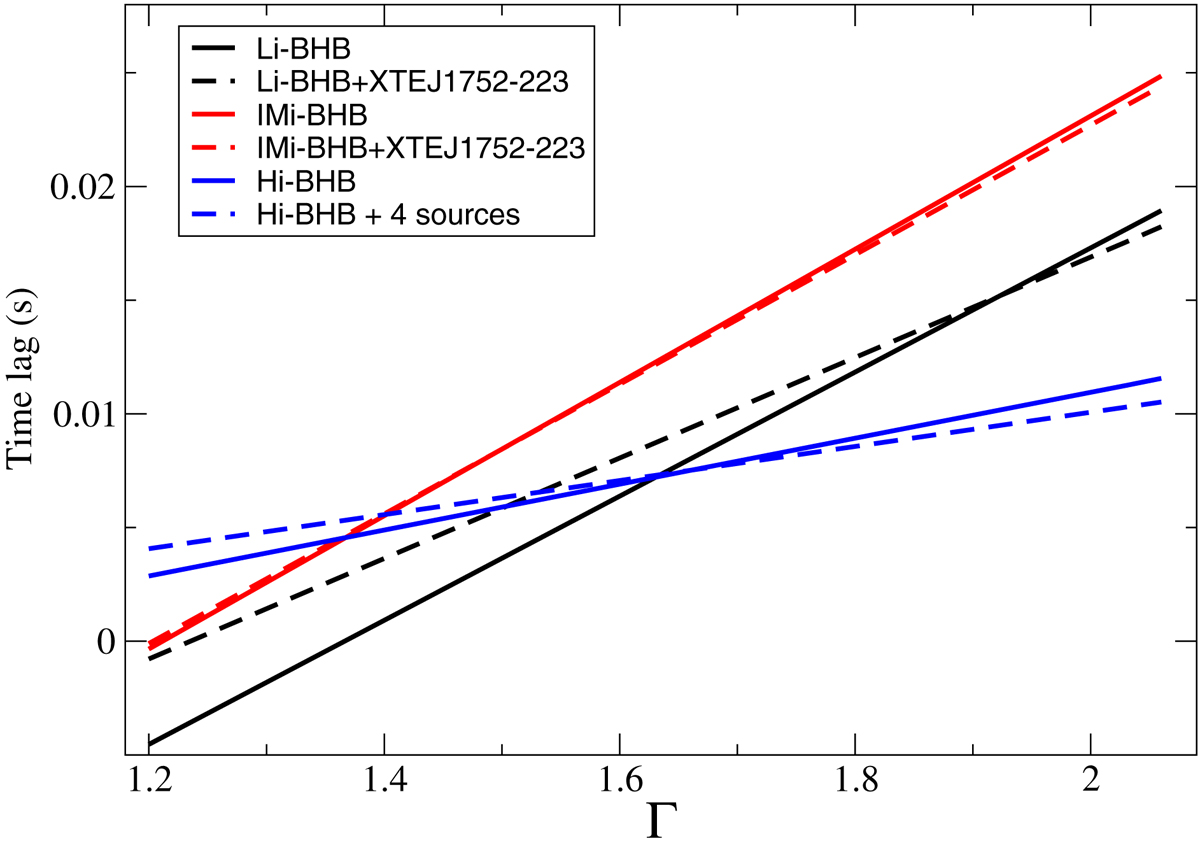
Average correlation between the time lag and photon index for different selections of sources. The blue dashed line corresponds to the Hi-BHB group with the addition of GS 1354–645, XTE J1859+226, Swift J1842.5–1124, and MAXI J1543–564.
Current usage metrics show cumulative count of Article Views (full-text article views including HTML views, PDF and ePub downloads, according to the available data) and Abstracts Views on Vision4Press platform.
Data correspond to usage on the plateform after 2015. The current usage metrics is available 48-96 hours after online publication and is updated daily on week days.
Initial download of the metrics may take a while.