Fig. 6.
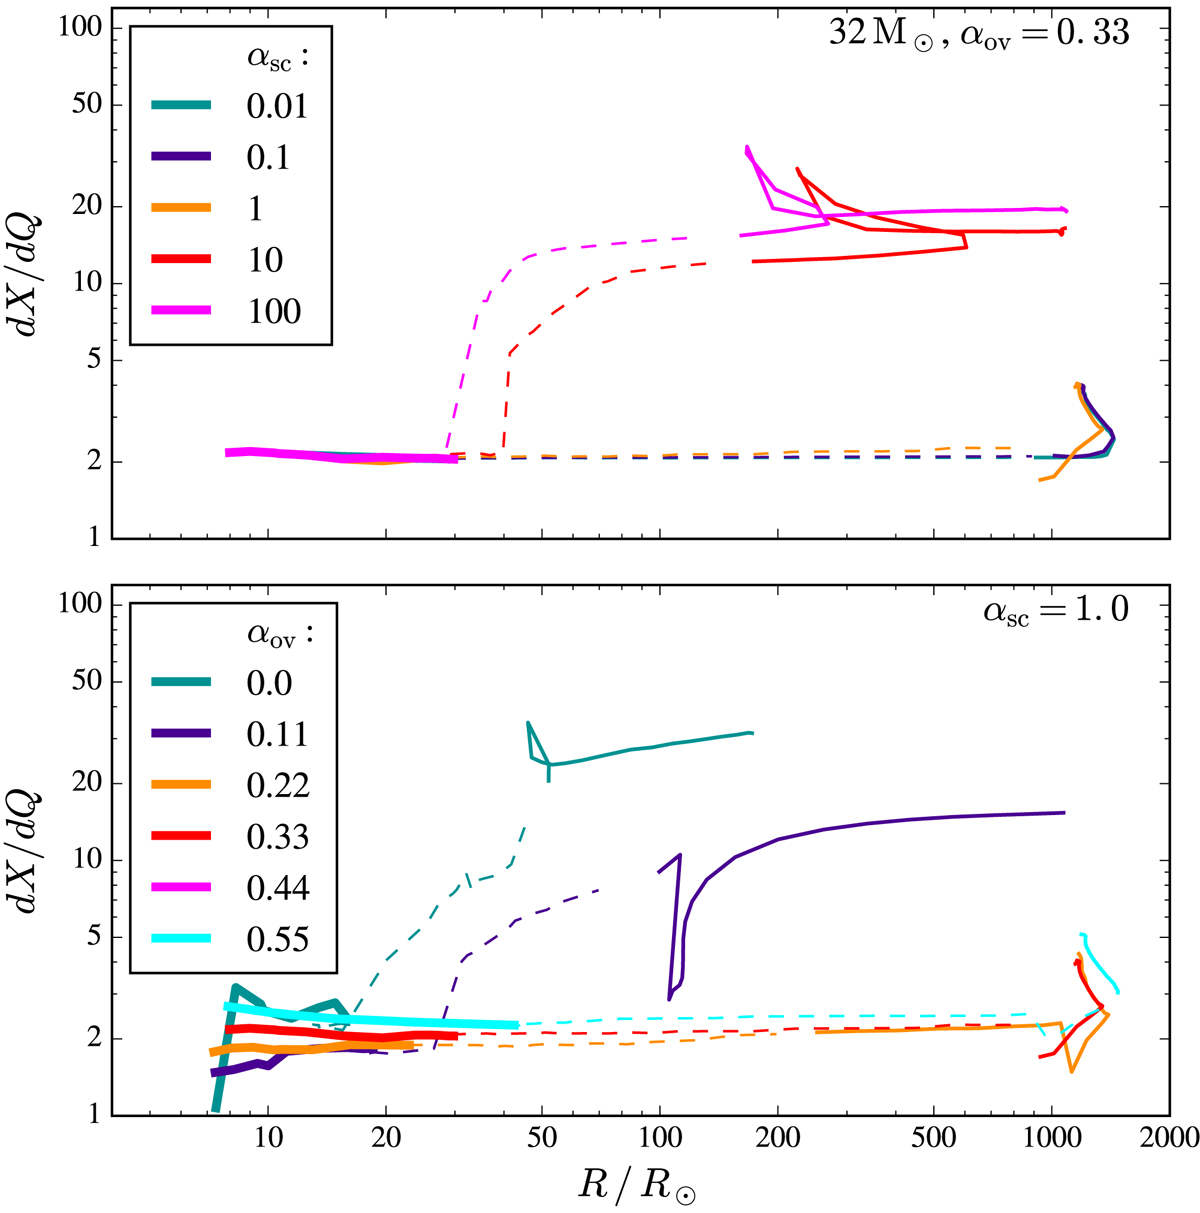
H/He gradient dX/dQ (cf. Fig. 1 in Sect. 2) as a function of stellar radius for 32 M⊙ sequences computed with various assumptions on internal mixing. Thick solid lines indicate core hydrogen burning and thin solid lines indicate core helium burning. The short-lived in-between phase is displayed with a dashed line. In the top panel, αov = 0.33 is adopted in all models while αsc is varied. In the bottom panel, all models are computed with αsc = 1 while αov is varied.
Current usage metrics show cumulative count of Article Views (full-text article views including HTML views, PDF and ePub downloads, according to the available data) and Abstracts Views on Vision4Press platform.
Data correspond to usage on the plateform after 2015. The current usage metrics is available 48-96 hours after online publication and is updated daily on week days.
Initial download of the metrics may take a while.