Fig. 5.
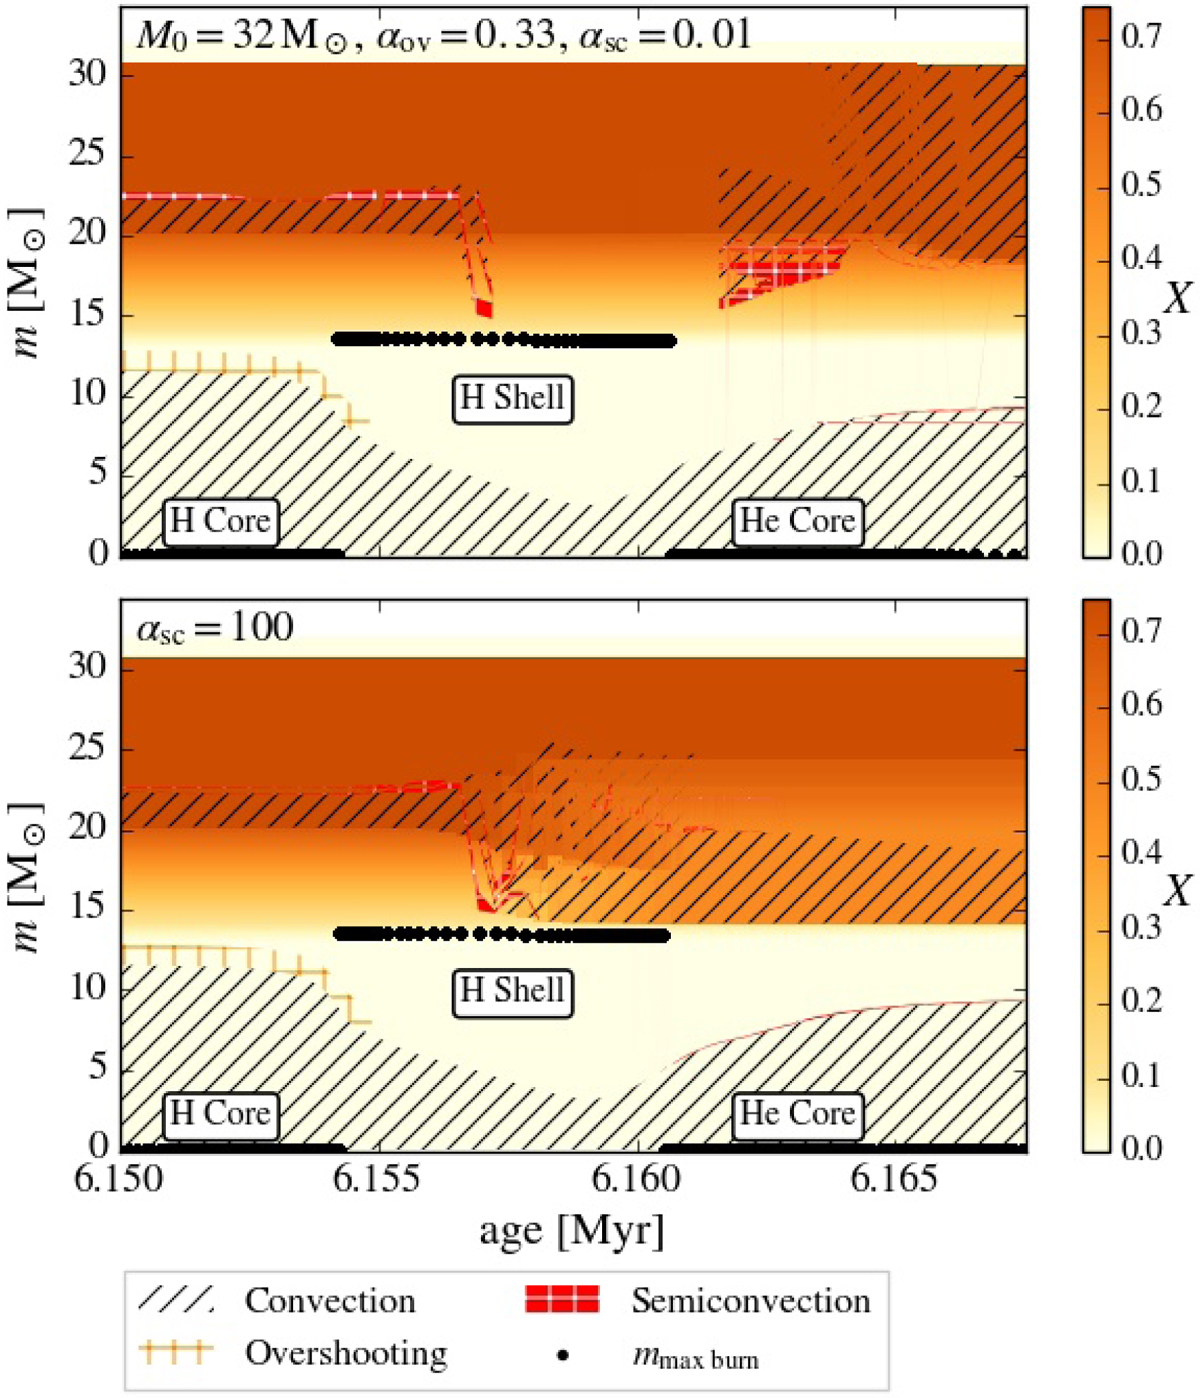
Kippenhahn diagram showing at what mass coordinates, m (y-axis), internal mixing regions arise, as well as the hydrogen mass fraction (color coded) as function of time for two 32 M⊙ evolutionary sequences. One is computed with inefficient semiconvective mixing (αsc = 0.01; top panel), and the other one is computed with efficient semiconvective mixing (αsc = 100; bottom panel). The displayed time interval starts near core hydrogen exhaustion and ends in the early stage of core helium burning. The overshooting parameter for both models is αov = 0.33, and rotation is not included. Black dots indicate the mass coordinate of the maximum specific nuclear energy generation.
Current usage metrics show cumulative count of Article Views (full-text article views including HTML views, PDF and ePub downloads, according to the available data) and Abstracts Views on Vision4Press platform.
Data correspond to usage on the plateform after 2015. The current usage metrics is available 48-96 hours after online publication and is updated daily on week days.
Initial download of the metrics may take a while.