Fig. 11.
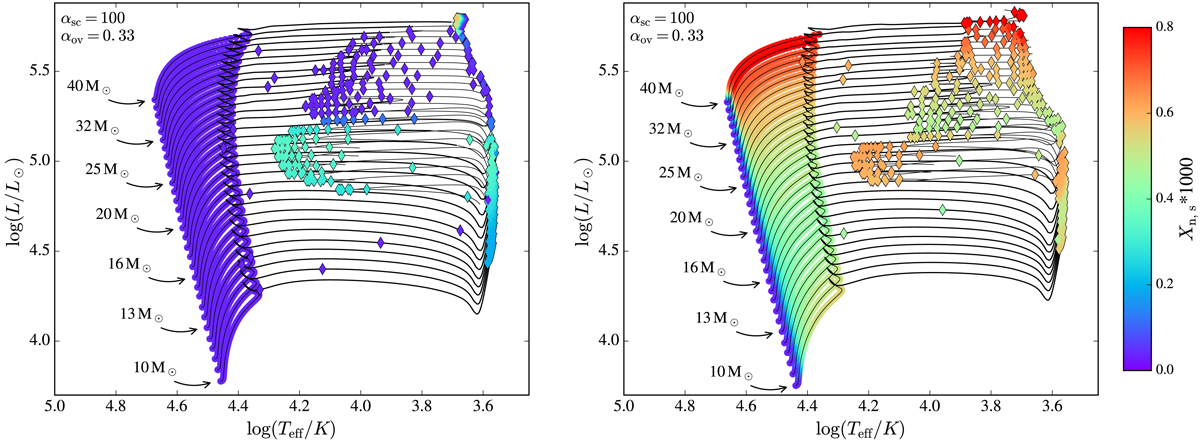
Hertzsprung–Russell diagram showing the nitrogen surface mass fraction of our evolutionary sequences with αsc = 100 and αsc = 0.33. The initial masses of the shown stellar tracks are evenly logarithmically spaced every 0.02 dex. Similarly to Fig. 2, a marker indicates a 50 000 yr time step, a circle indicates core hydrogen burning, and a diamond indicates core helium burning. Left: model sequences are nonrotating. Right: model sequences have an initial rotation velocity of 300 km s−1.
Current usage metrics show cumulative count of Article Views (full-text article views including HTML views, PDF and ePub downloads, according to the available data) and Abstracts Views on Vision4Press platform.
Data correspond to usage on the plateform after 2015. The current usage metrics is available 48-96 hours after online publication and is updated daily on week days.
Initial download of the metrics may take a while.