Free Access
Fig. 10.
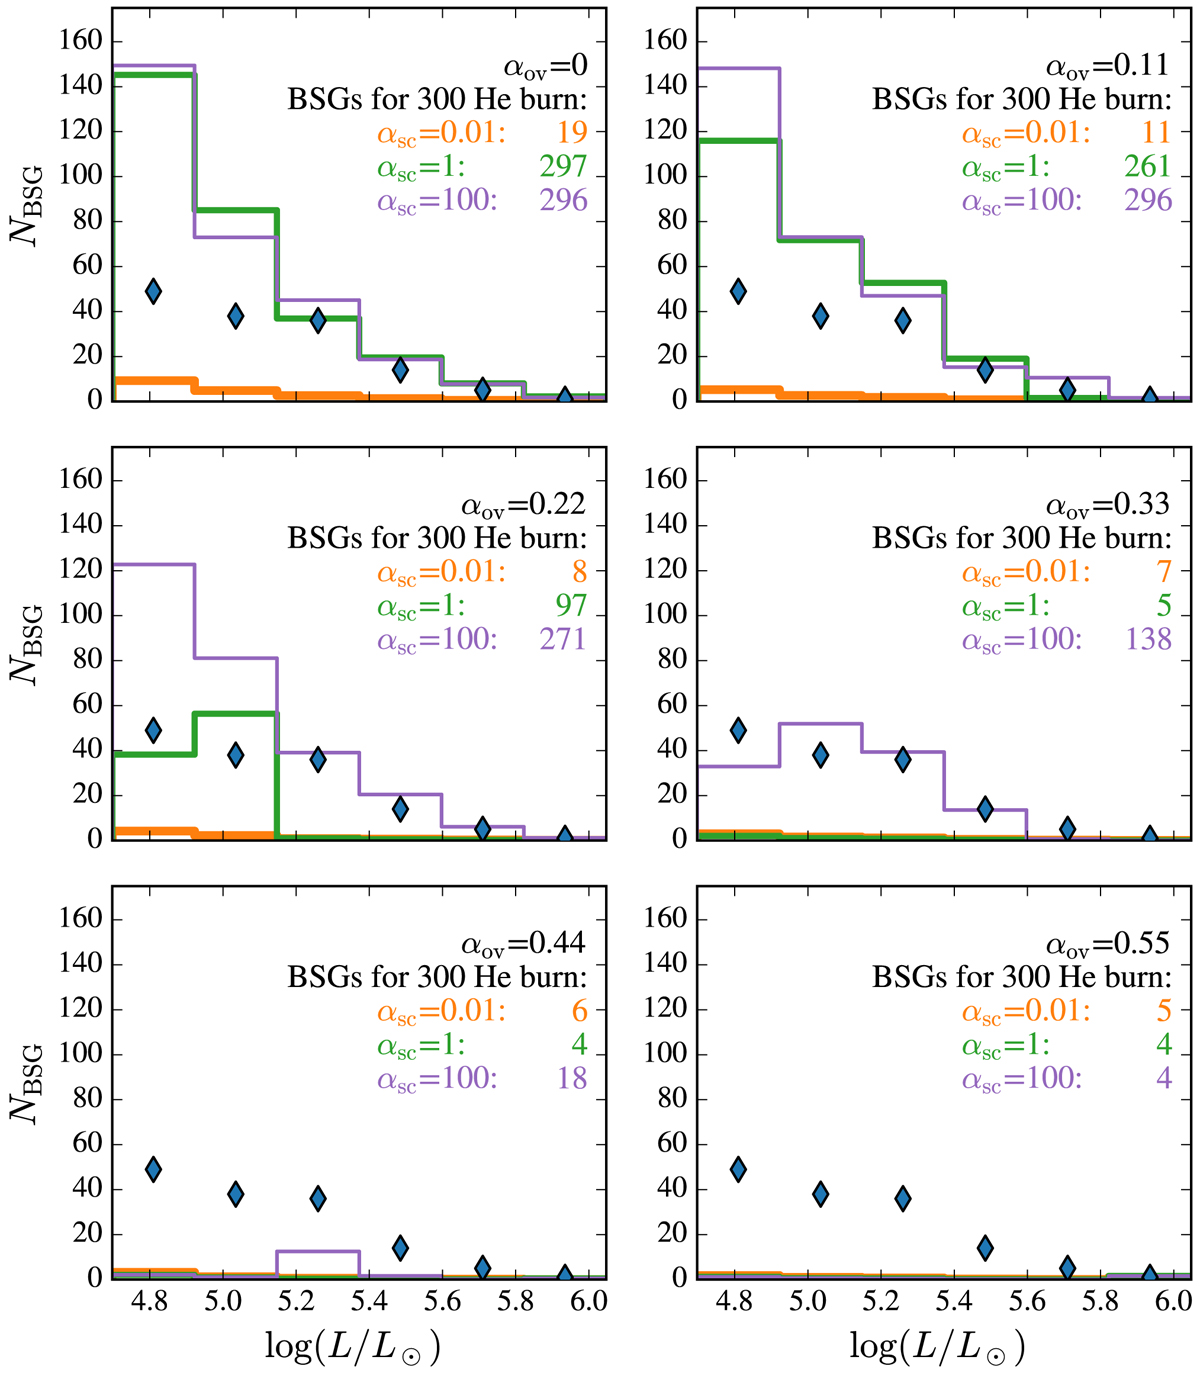
As in Fig. 9, but this diagram is showing the luminosity distribution of blue supergiants. Here, blue diamonds indicate the combined number of blue supergiants observed in the SMC by Humphreys et al. (1991) and Kalari et al. (2018).
Current usage metrics show cumulative count of Article Views (full-text article views including HTML views, PDF and ePub downloads, according to the available data) and Abstracts Views on Vision4Press platform.
Data correspond to usage on the plateform after 2015. The current usage metrics is available 48-96 hours after online publication and is updated daily on week days.
Initial download of the metrics may take a while.