Fig. 1.
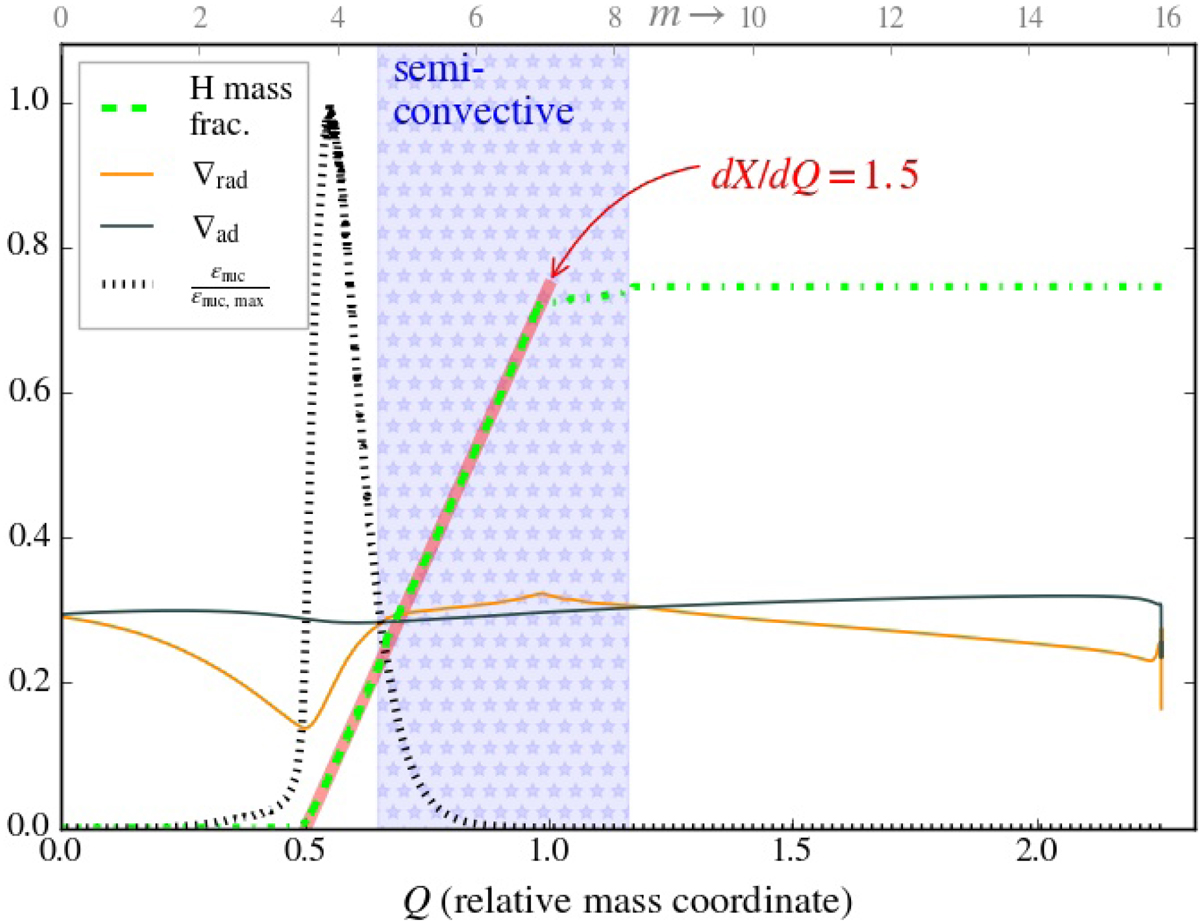
Various quantities of our 16 M⊙ stellar model computed with αov = 0.11 after core hydrogen depletion as a function of the internal mass coordinate. The model is undergoing hydrogen shell burning, as indicated by the relative rate of nuclear energy production (black dotted line). The hydrogen mass fraction is shown in green. The part of the hydrogen profile that was used to fit the H/He gradient dX/dQ (see main text) is shown with a dashed line; the rest is shown with a dot-dashed line. The resulting fit is shown as a straight red line. The semiconvective region, where the radiative temperature gradient ∇rad exceeds the adiabatic temperature gradient ∇ad in the presence of a stabilizing mean molecular weight gradient, is shaded in blue.
Current usage metrics show cumulative count of Article Views (full-text article views including HTML views, PDF and ePub downloads, according to the available data) and Abstracts Views on Vision4Press platform.
Data correspond to usage on the plateform after 2015. The current usage metrics is available 48-96 hours after online publication and is updated daily on week days.
Initial download of the metrics may take a while.