Fig. 9
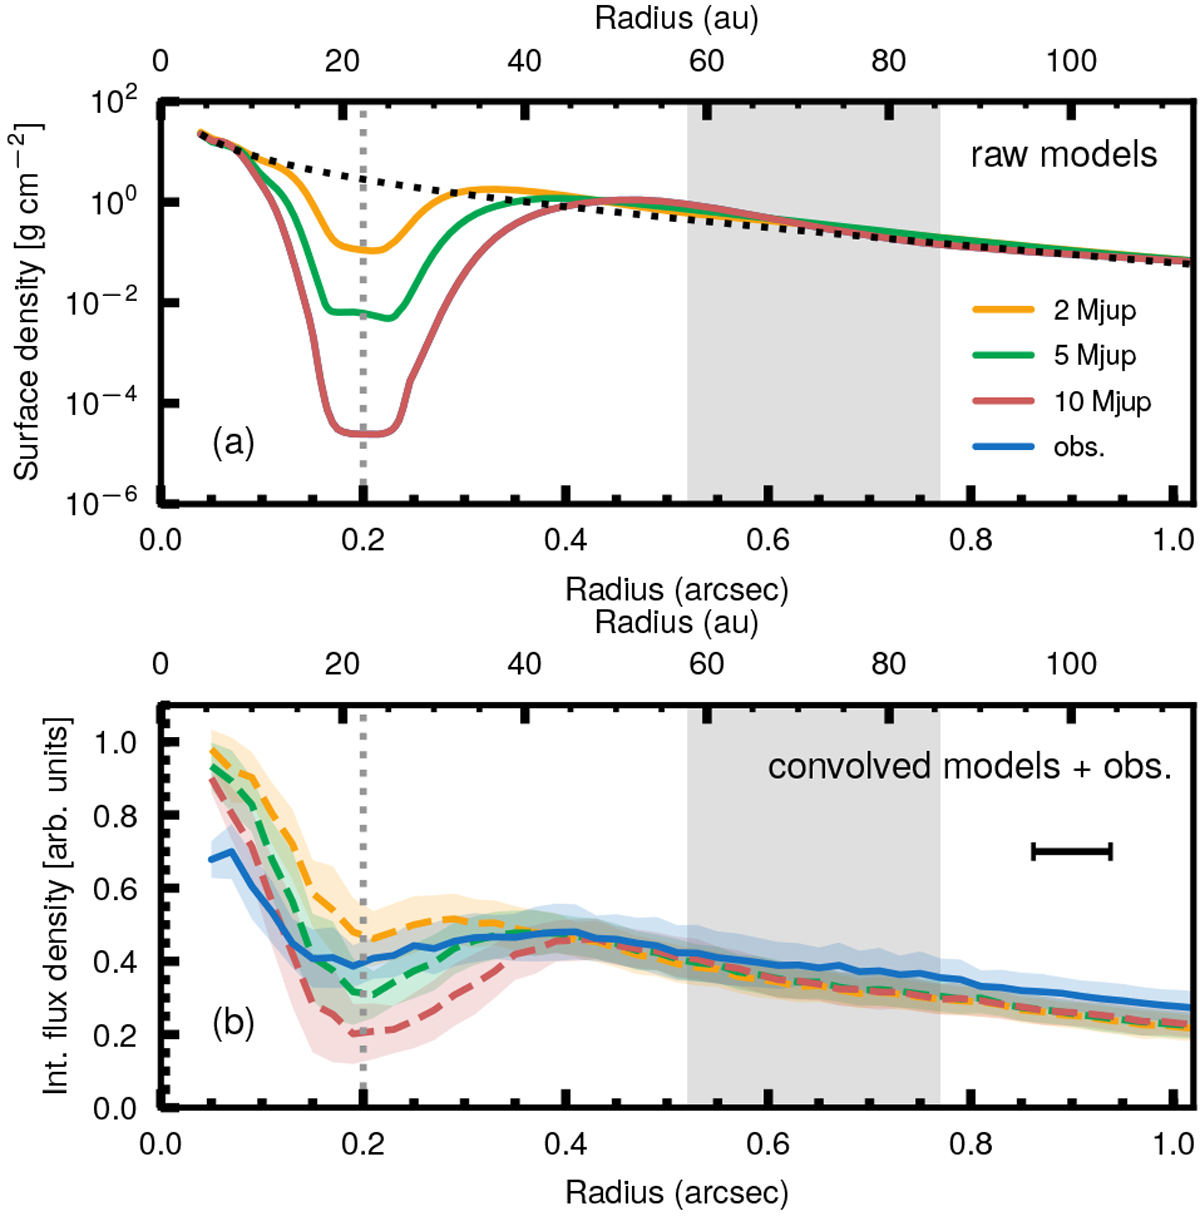
Comparison of hydrodynamical models including a 2 MJup (yellow), 5 MJup (green), and 10 MJup (red) planet located at 0.2′′ with the observations (blue). Panel a: azimuthally averaged surface density profiles of hydrodynamical simulations. The dotted line corresponds to the initial unperturbed surface density profile. Panel b: integrated azimuthally averaged CO flux density of observations and ALMA-simulated models, after applying 2σ clipping.In each panel, the gray shaded area indicates the extension of the continuum ring, and the vertical dotted line corresponds to the approximate location of PDS 70 b.The black bar in the second panel indicates the major axis of the beam (0.076′′).
Current usage metrics show cumulative count of Article Views (full-text article views including HTML views, PDF and ePub downloads, according to the available data) and Abstracts Views on Vision4Press platform.
Data correspond to usage on the plateform after 2015. The current usage metrics is available 48-96 hours after online publication and is updated daily on week days.
Initial download of the metrics may take a while.