Fig. 7
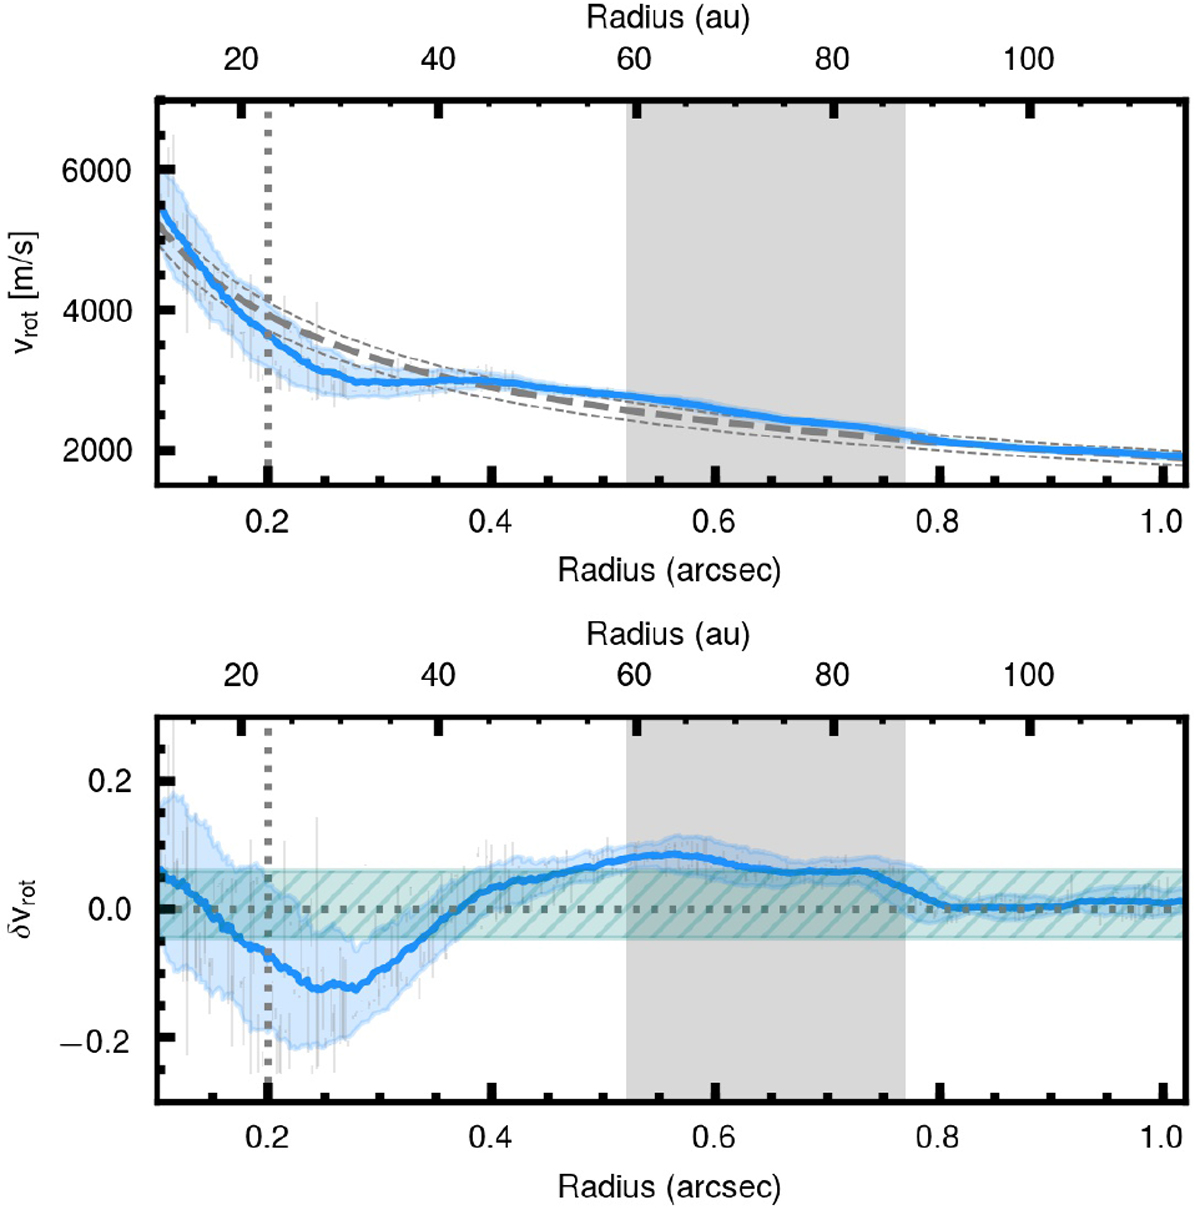
Top panel: measured rotation curve with 1σ uncertainties. The blue line and blue shadowed area show the running mean and its standard deviation. The dashed gray lines show the Keplerian rotation curve assuming the best-fit stellar mass (0.88 M⊙, thick) and including the 3σ uncertainties on the stellar mass (corresponding to 0.79 and 0.97 M⊙ respectively, thin) derived from the rotation map fitting. The uncertainties of the stellar mass correspondto the statistical uncertainties and do not include the systematics. Bottom panel: relative residuals (blue solid) and uncertainties (blue shaded area) between a smooth Keplerian curve and the inferred rotation curve. The green hatched area highlights the uncertainty of the absolute scaling of δvrot inferred by the 3σ statistical uncertainties on the stellar mass. In both panels, the gray shaded region shows the extent of the continuum ring. The vertical dotted line shows the orbit of PDS 70 b and the shaded vertical gray region traces the location of the continuum emission.
Current usage metrics show cumulative count of Article Views (full-text article views including HTML views, PDF and ePub downloads, according to the available data) and Abstracts Views on Vision4Press platform.
Data correspond to usage on the plateform after 2015. The current usage metrics is available 48-96 hours after online publication and is updated daily on week days.
Initial download of the metrics may take a while.