Fig. 6
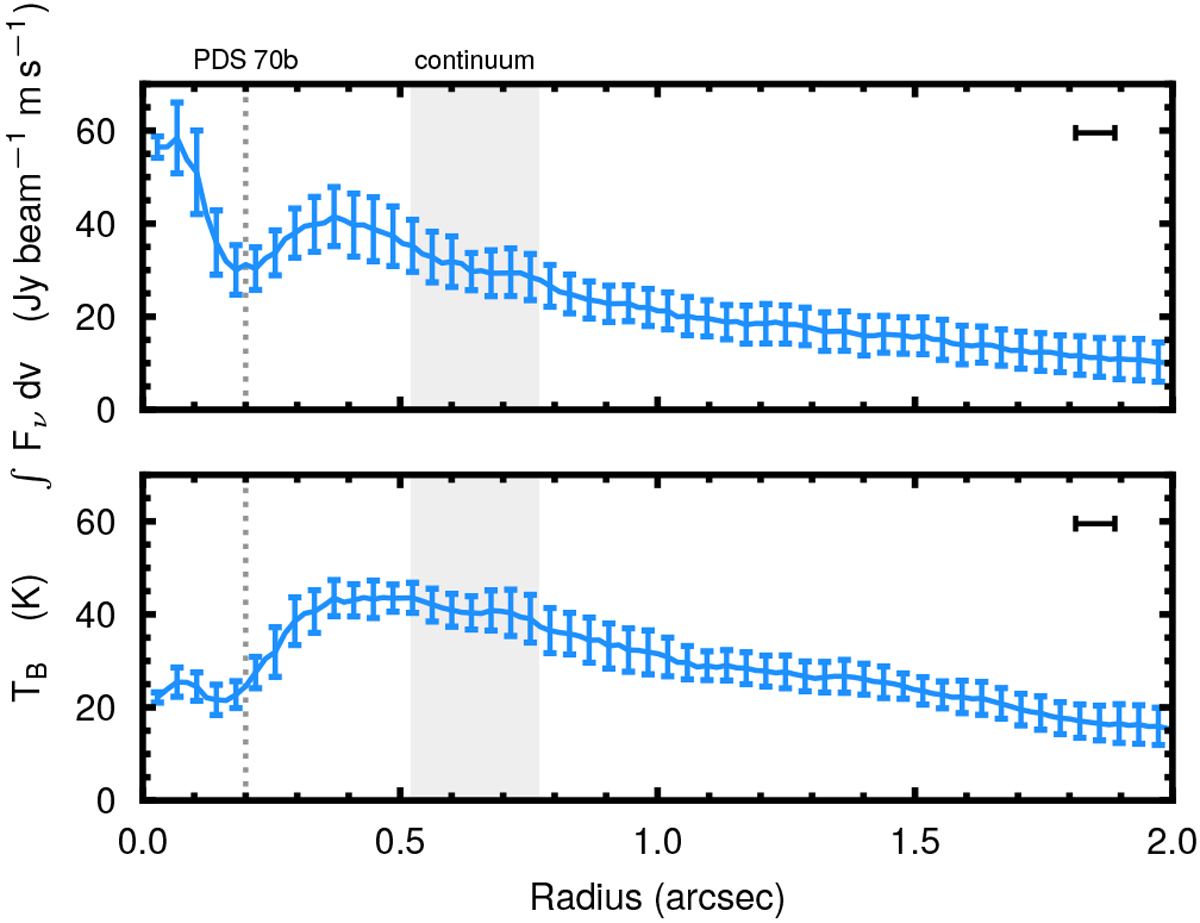
Radial profiles of the 12CO integrated intensity (top), and brightness temperature (bottom). Radial samples are taken every 1/4 beam and the error bar shows the standard deviation in the azimuthal bin. The vertical dotted line shows the orbit of PDS 70b, while the gray shaded region shows the extent of the continuum ring. The beam size is shown in the top right corner of each panel.
Current usage metrics show cumulative count of Article Views (full-text article views including HTML views, PDF and ePub downloads, according to the available data) and Abstracts Views on Vision4Press platform.
Data correspond to usage on the plateform after 2015. The current usage metrics is available 48-96 hours after online publication and is updated daily on week days.
Initial download of the metrics may take a while.