Open Access
Fig. 5
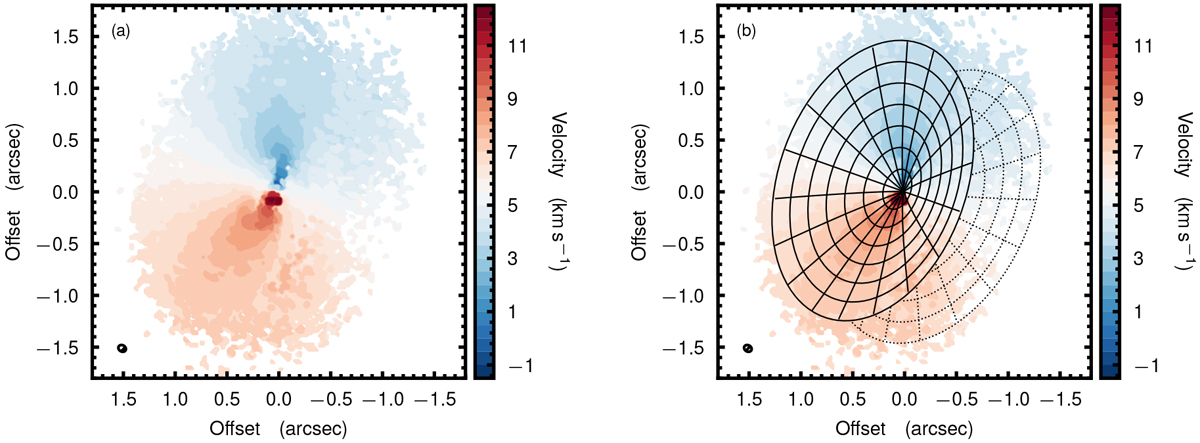
Rotation profile of the 12CO emission (left), using the method presented in Teague & Foreman-Mackey (2018), with the best-fit surface overlaid (right). The solid lines show the top surface, and the dotted lines show the far surface.
Current usage metrics show cumulative count of Article Views (full-text article views including HTML views, PDF and ePub downloads, according to the available data) and Abstracts Views on Vision4Press platform.
Data correspond to usage on the plateform after 2015. The current usage metrics is available 48-96 hours after online publication and is updated daily on week days.
Initial download of the metrics may take a while.