Fig. 4
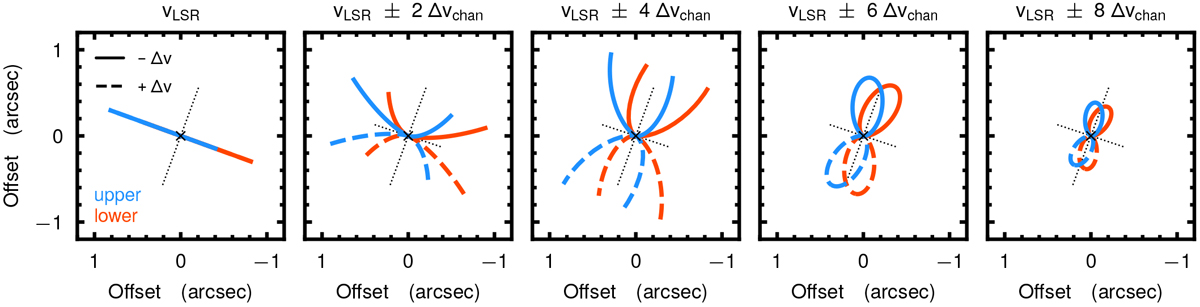
Iso-velocity contours for the upper (blue) and lower (red) sides of the disk at different velocities with a flared emission surface. Along the major and minor axes, shown by the black dotted lines, the iso-velocity contours overlap, as in the leftmost and rightmost panels, and thus only emission from the upper side of the disk is visible. Conversely, in inter-axis regions, the iso-velocity contours are spatially separated, as in the central panels, so that emission from both sides of the disk reaches the observer. Based on Fig. 4 from Rosenfeld et al. (2013).
Current usage metrics show cumulative count of Article Views (full-text article views including HTML views, PDF and ePub downloads, according to the available data) and Abstracts Views on Vision4Press platform.
Data correspond to usage on the plateform after 2015. The current usage metrics is available 48-96 hours after online publication and is updated daily on week days.
Initial download of the metrics may take a while.