Fig. 2
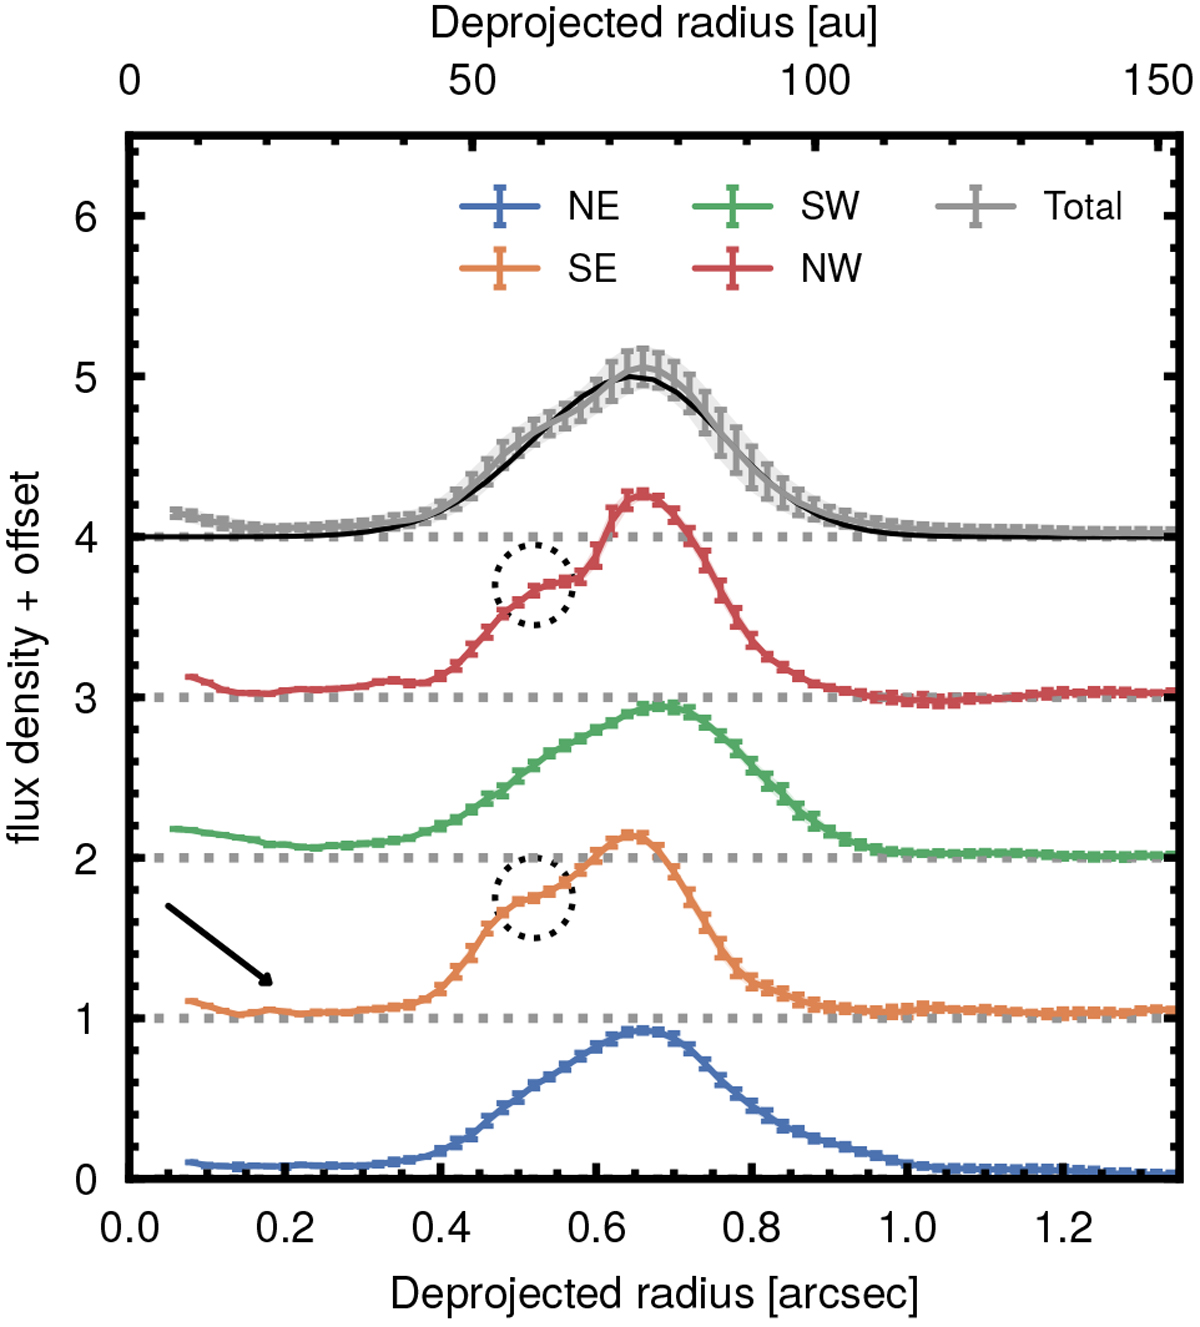
Radial profiles of the deprojected dust continuum image along the semi-major (red, orange) and the semi-minor (green, blue) axes, as well as averaged over the entire azimuth (gray). The black line in the uppermost plot corresponds to the best-fit model of the radial profile found in Sect. 3.1.1. The deprojection assumes that the continuum is geometrically flat. Radial samples are taken every ~1/4 beam (20 mas), and the cuts along the minor and major axes are azimuthally averaged in a cone of ±10° around the corresponding axes. The black arrow highlights a bump in the profile close to the location of PDS 70 b, and the dotted circles mark the location of the second peak.
Current usage metrics show cumulative count of Article Views (full-text article views including HTML views, PDF and ePub downloads, according to the available data) and Abstracts Views on Vision4Press platform.
Data correspond to usage on the plateform after 2015. The current usage metrics is available 48-96 hours after online publication and is updated daily on week days.
Initial download of the metrics may take a while.