Fig. 11
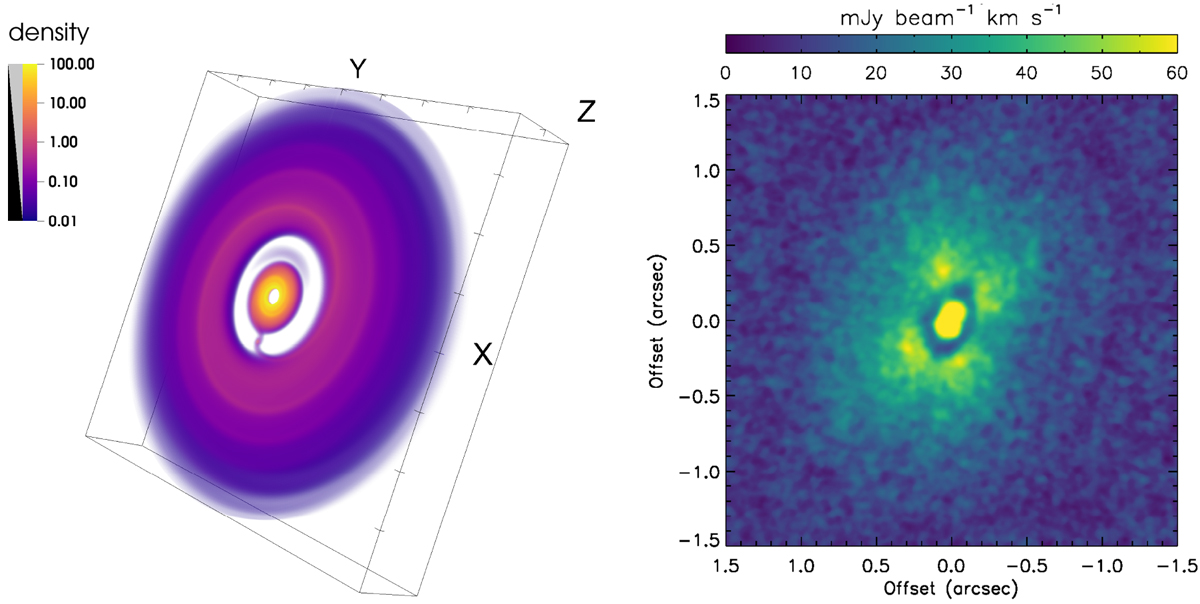
Left panel: three-dimensional volume rendering of the gas density (in a normalized unit with logarithmic scaling) after evolution of 1000 orbits in the inner 100 au of the model disk with a 5 MJup planet at 22 au. Ticks on the axes mark every 25 au. Right panel: simulated 12CO zeroth-moment map based on the hydrodynamic model presented in the left panel.
Current usage metrics show cumulative count of Article Views (full-text article views including HTML views, PDF and ePub downloads, according to the available data) and Abstracts Views on Vision4Press platform.
Data correspond to usage on the plateform after 2015. The current usage metrics is available 48-96 hours after online publication and is updated daily on week days.
Initial download of the metrics may take a while.