Fig. 10
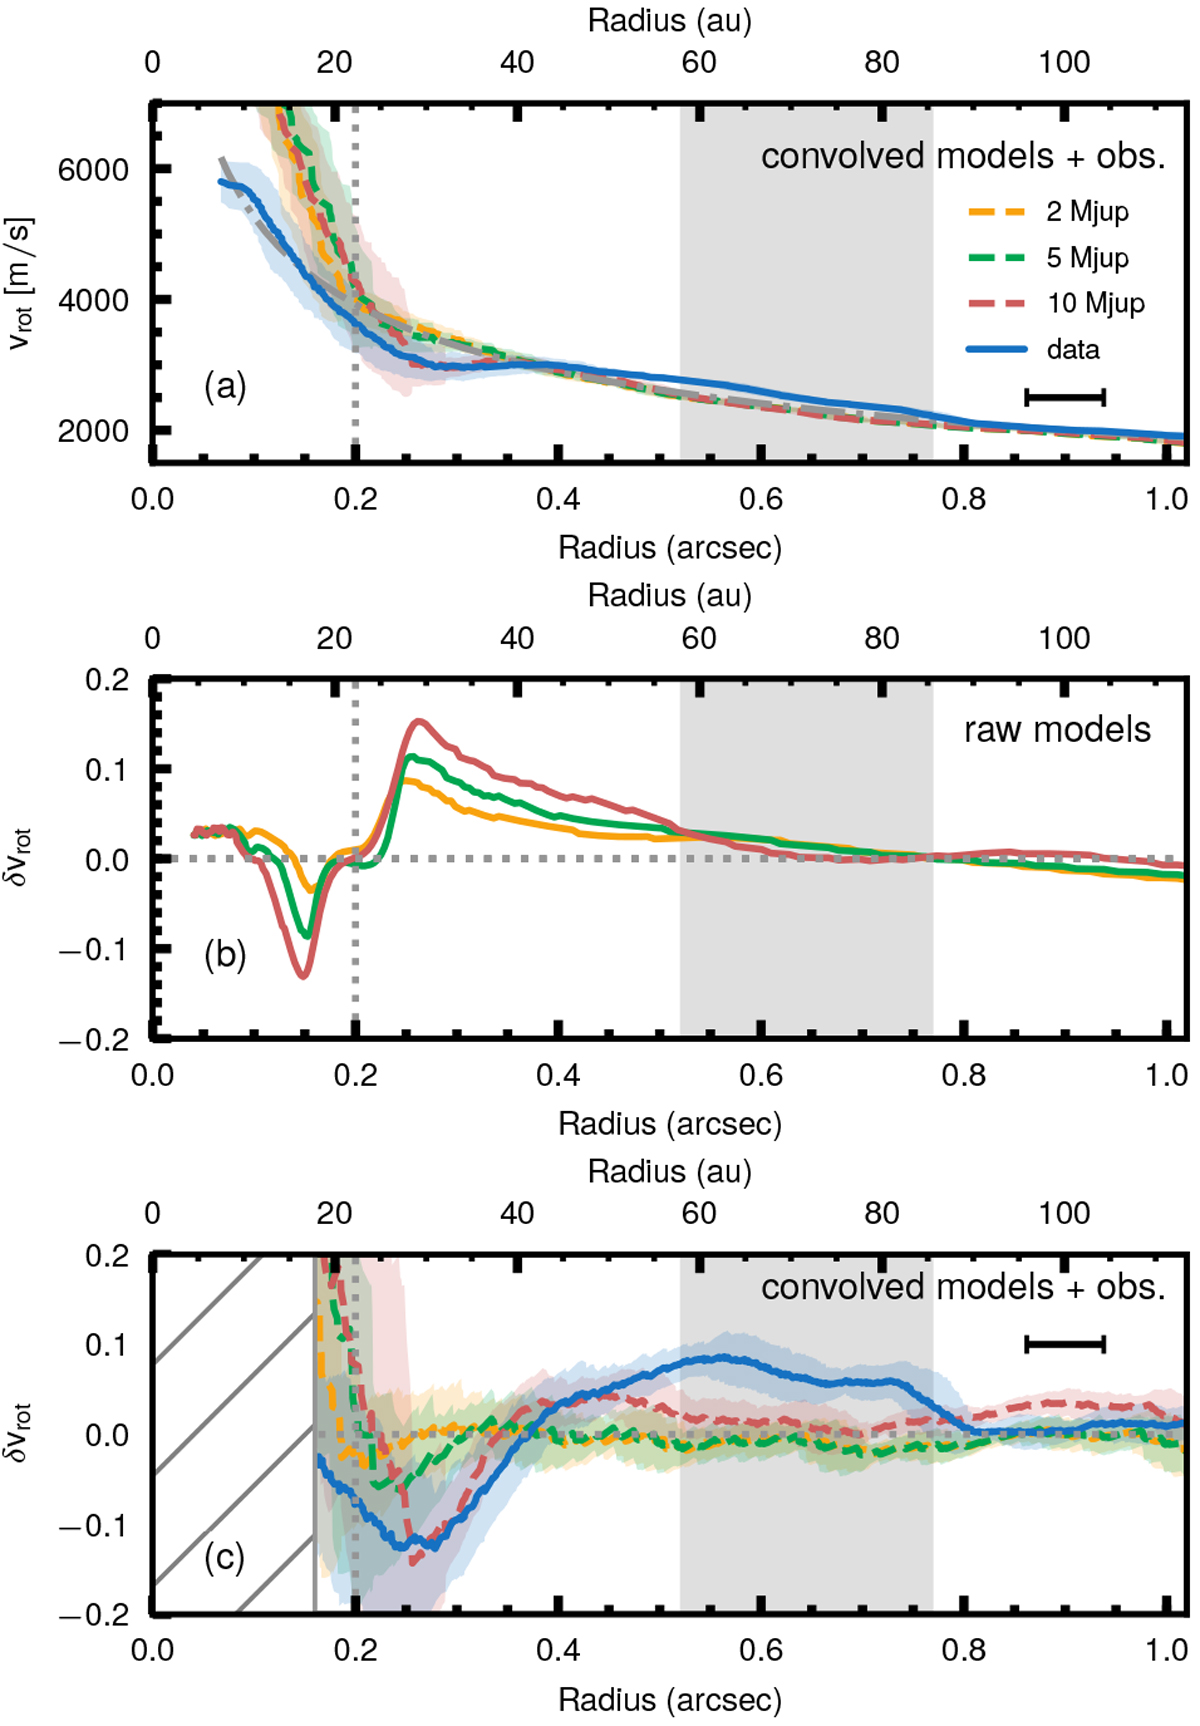
Comparison of hydrodynamical models including a 2 MJup (yellow), 5 MJup (green), and 10 MJup (red) planet located at 0.2′′ with the observations (blue). Panel a: rotation velocity as a function of deprojected distance. The gray dash-dotted line indicates the unperturbed Keplerian profile around a 0.88 M⊙ star. Panel b: deviation from Keplerian rotation of the hydrodynamical simulations at the τ = 1 surface. Panel c: deviation from Keplerian rotation of ALMA-simulated models and observations. The plot shows the running mean and standard deviations. The inner region up to 160 mas is affected by beam confusion effects and is therefore blocked out. In each panel, the gray shaded area indicates the extension of the continuum ring, and the vertical dotted line corresponds to the approximate location of PDS 70 b. The black bar in the first and third panel indicates the major axis of the beam (0.076′′).
Current usage metrics show cumulative count of Article Views (full-text article views including HTML views, PDF and ePub downloads, according to the available data) and Abstracts Views on Vision4Press platform.
Data correspond to usage on the plateform after 2015. The current usage metrics is available 48-96 hours after online publication and is updated daily on week days.
Initial download of the metrics may take a while.