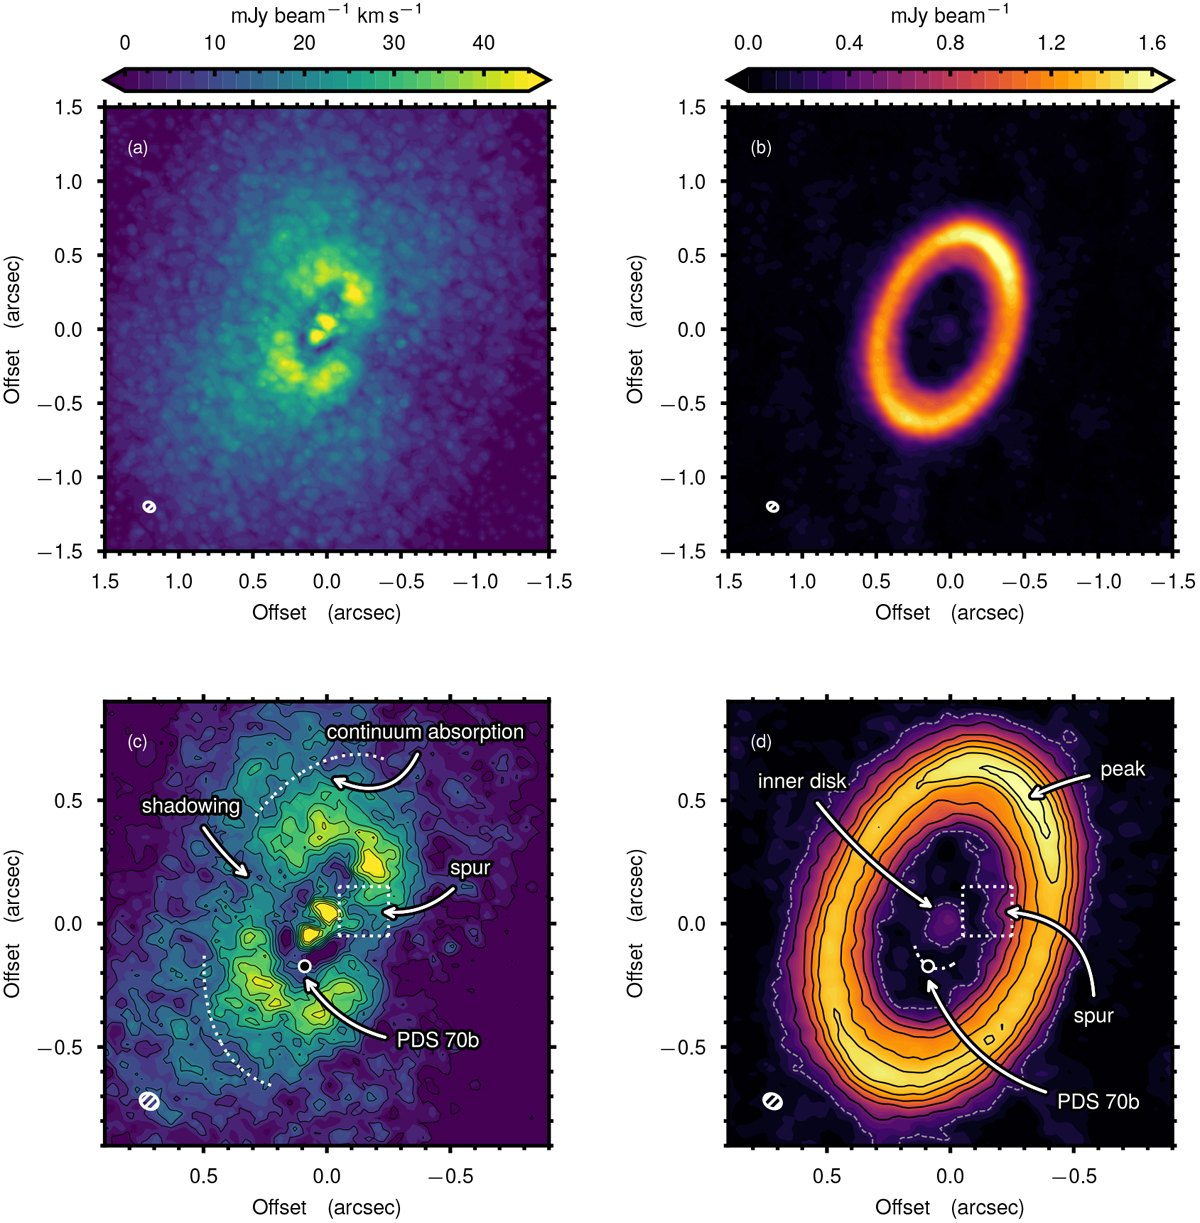
Fig. 1

Observations of the 12CO (left column) and the 350.6 GHz continuum (right column). Bottom row: closer view of the observations including annotations where the color scaling has been stretched to bring out detail. The contours for the 12CO are startingat 20% of the peak value to the peak in steps of 10%. For the continuum, the gray dashed contour is 5σ, and black contours start at 10σ and increase in steps of 10σ, where σ = 26 μJy beam−1. The synthesized beams are shown in the bottom left corner of each panel.
Current usage metrics show cumulative count of Article Views (full-text article views including HTML views, PDF and ePub downloads, according to the available data) and Abstracts Views on Vision4Press platform.
Data correspond to usage on the plateform after 2015. The current usage metrics is available 48-96 hours after online publication and is updated daily on week days.
Initial download of the metrics may take a while.


