Fig. C.1.
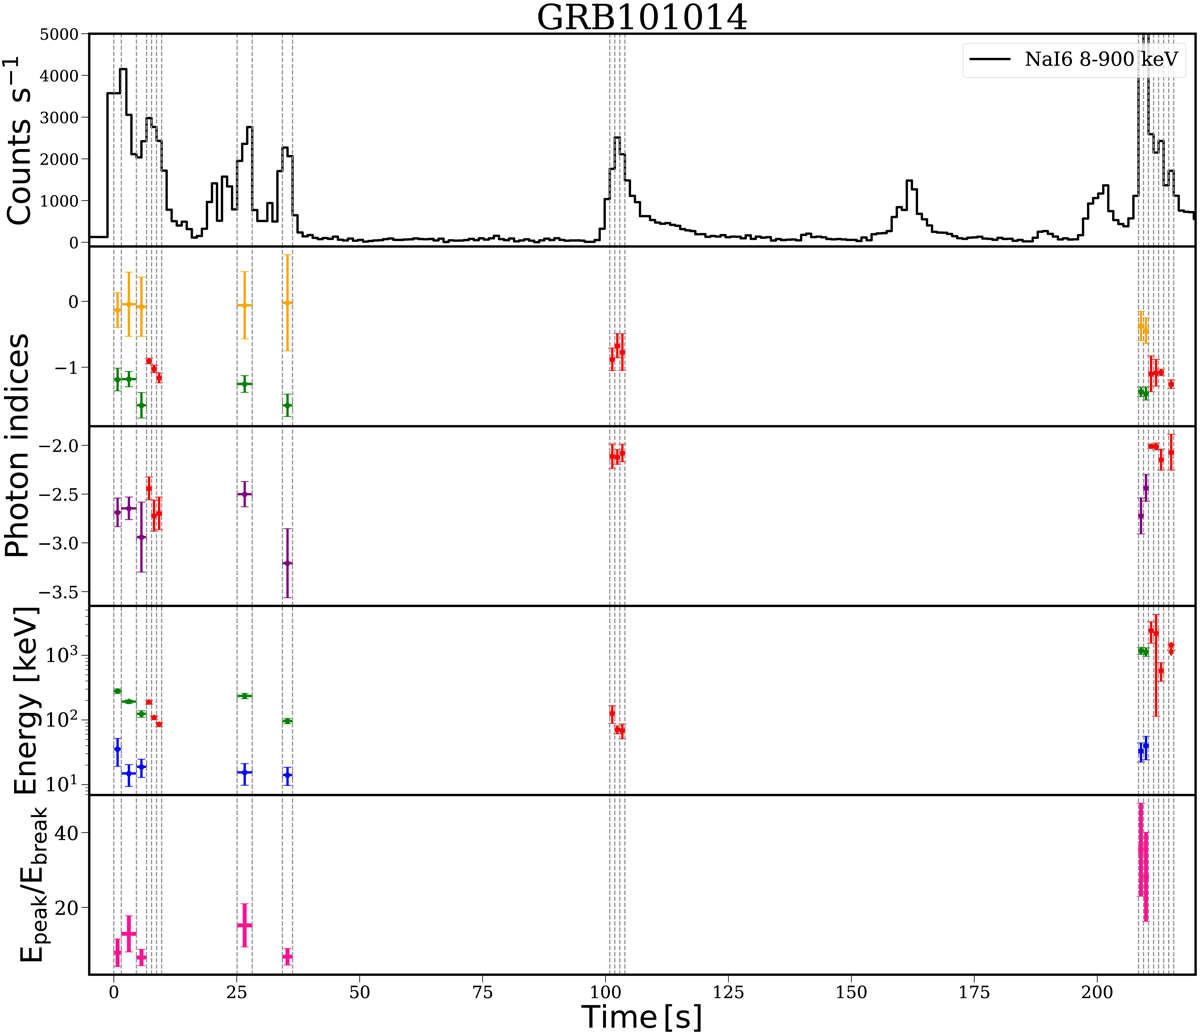
Evolution of the best fit spectral parameters for each GRB displaying a low-energy break. First panel: light curve of the GRB, in the energy range 8–900 keV. The vertical lines mark the time bins selected for the time-resolved analysis. Panels below: temporal evolution of all best fit parameters (of the 2SBPL or SBPL function, according to which model fits best the spectrum of the time bin). While all the parameters of the SBPL fit are shown as red points, different colours have been used to represent the parameters of the 2SBPL fit. In particular, from top to bottom, second panel: photon indices α1 (yellow points) and α2 (green points) of the 2SBPL function, and α (red points) of the SBPL function. Third panel: two photon indices β (in purple for the 2SBPL function and in red for SBPL). Fourth panel: Ebreak (blue points) and Epeak (green points) for 2SBPL, and Epeak for SBPL (red points). Bottom panel: ratio Epeak/Ebreak.
Current usage metrics show cumulative count of Article Views (full-text article views including HTML views, PDF and ePub downloads, according to the available data) and Abstracts Views on Vision4Press platform.
Data correspond to usage on the plateform after 2015. The current usage metrics is available 48-96 hours after online publication and is updated daily on week days.
Initial download of the metrics may take a while.