Fig. B.1.
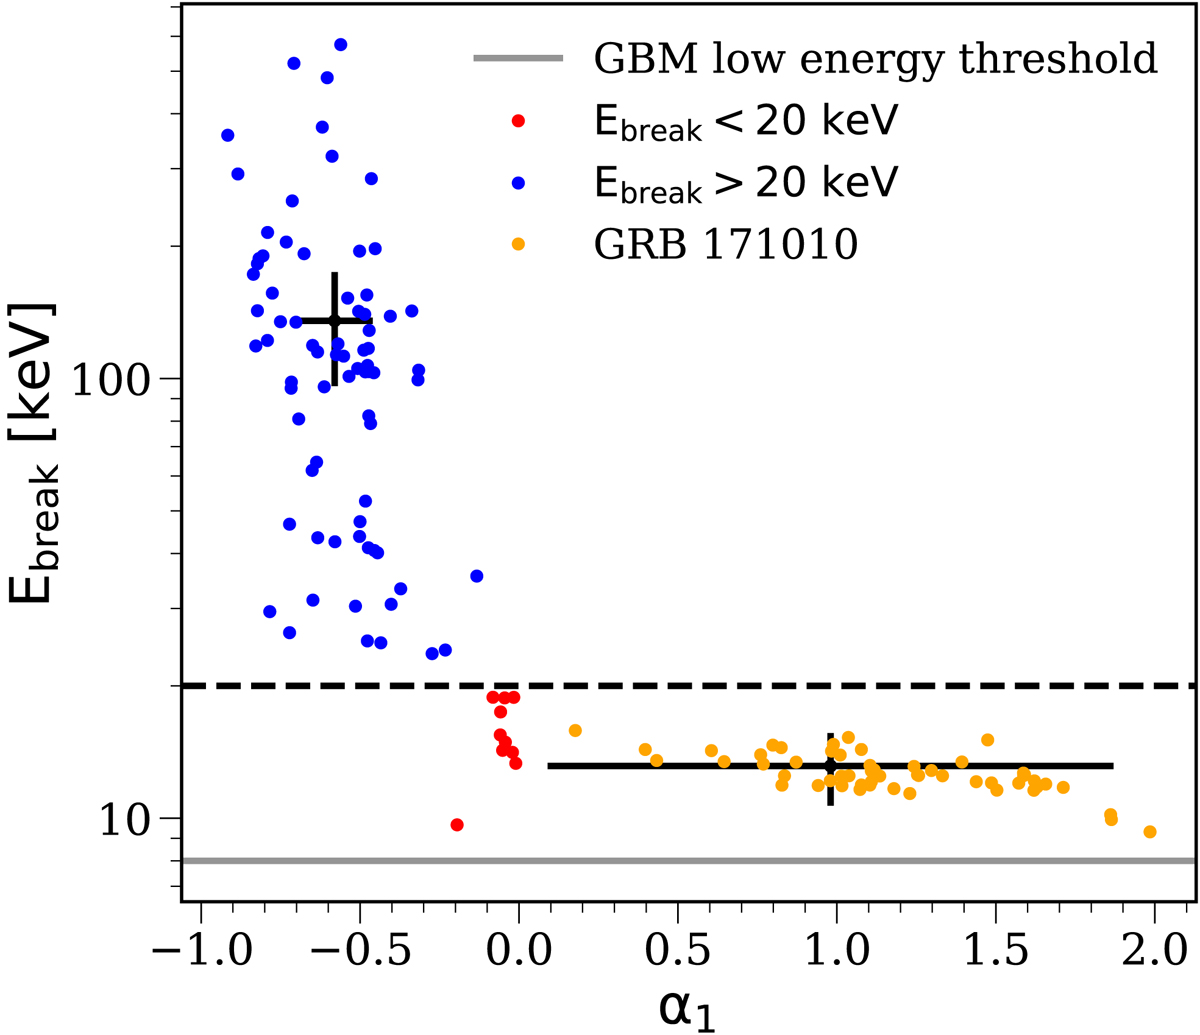
Relation between the break energy Ebreak and the index α1 of the power law describing the spectrum below Ebreak. The sample includes all time-resolved spectra of the ten long GRBs analysed in this work. The dashed black horizontal line indicates a difference in behaviour, with spectra below this line having very hard and ill-constrained best fit values of α1. All the parameter distributions and their mean values and standard deviations presented in this work rely only on spectra with Ebreak larger than this threshold value (blue points). The majority (∼85%) of the spectra with Ebreak < 20 keV (red points) belong to one specific GRB, namely GRB 171010 (orange points). The mean values of Ebreak and α1 (along with their average errors) are represented for each sample with the solid black lines. The low-energy threshold of the GBM NaI detectors is shown with a grey solid line.
Current usage metrics show cumulative count of Article Views (full-text article views including HTML views, PDF and ePub downloads, according to the available data) and Abstracts Views on Vision4Press platform.
Data correspond to usage on the plateform after 2015. The current usage metrics is available 48-96 hours after online publication and is updated daily on week days.
Initial download of the metrics may take a while.