Fig. 4.
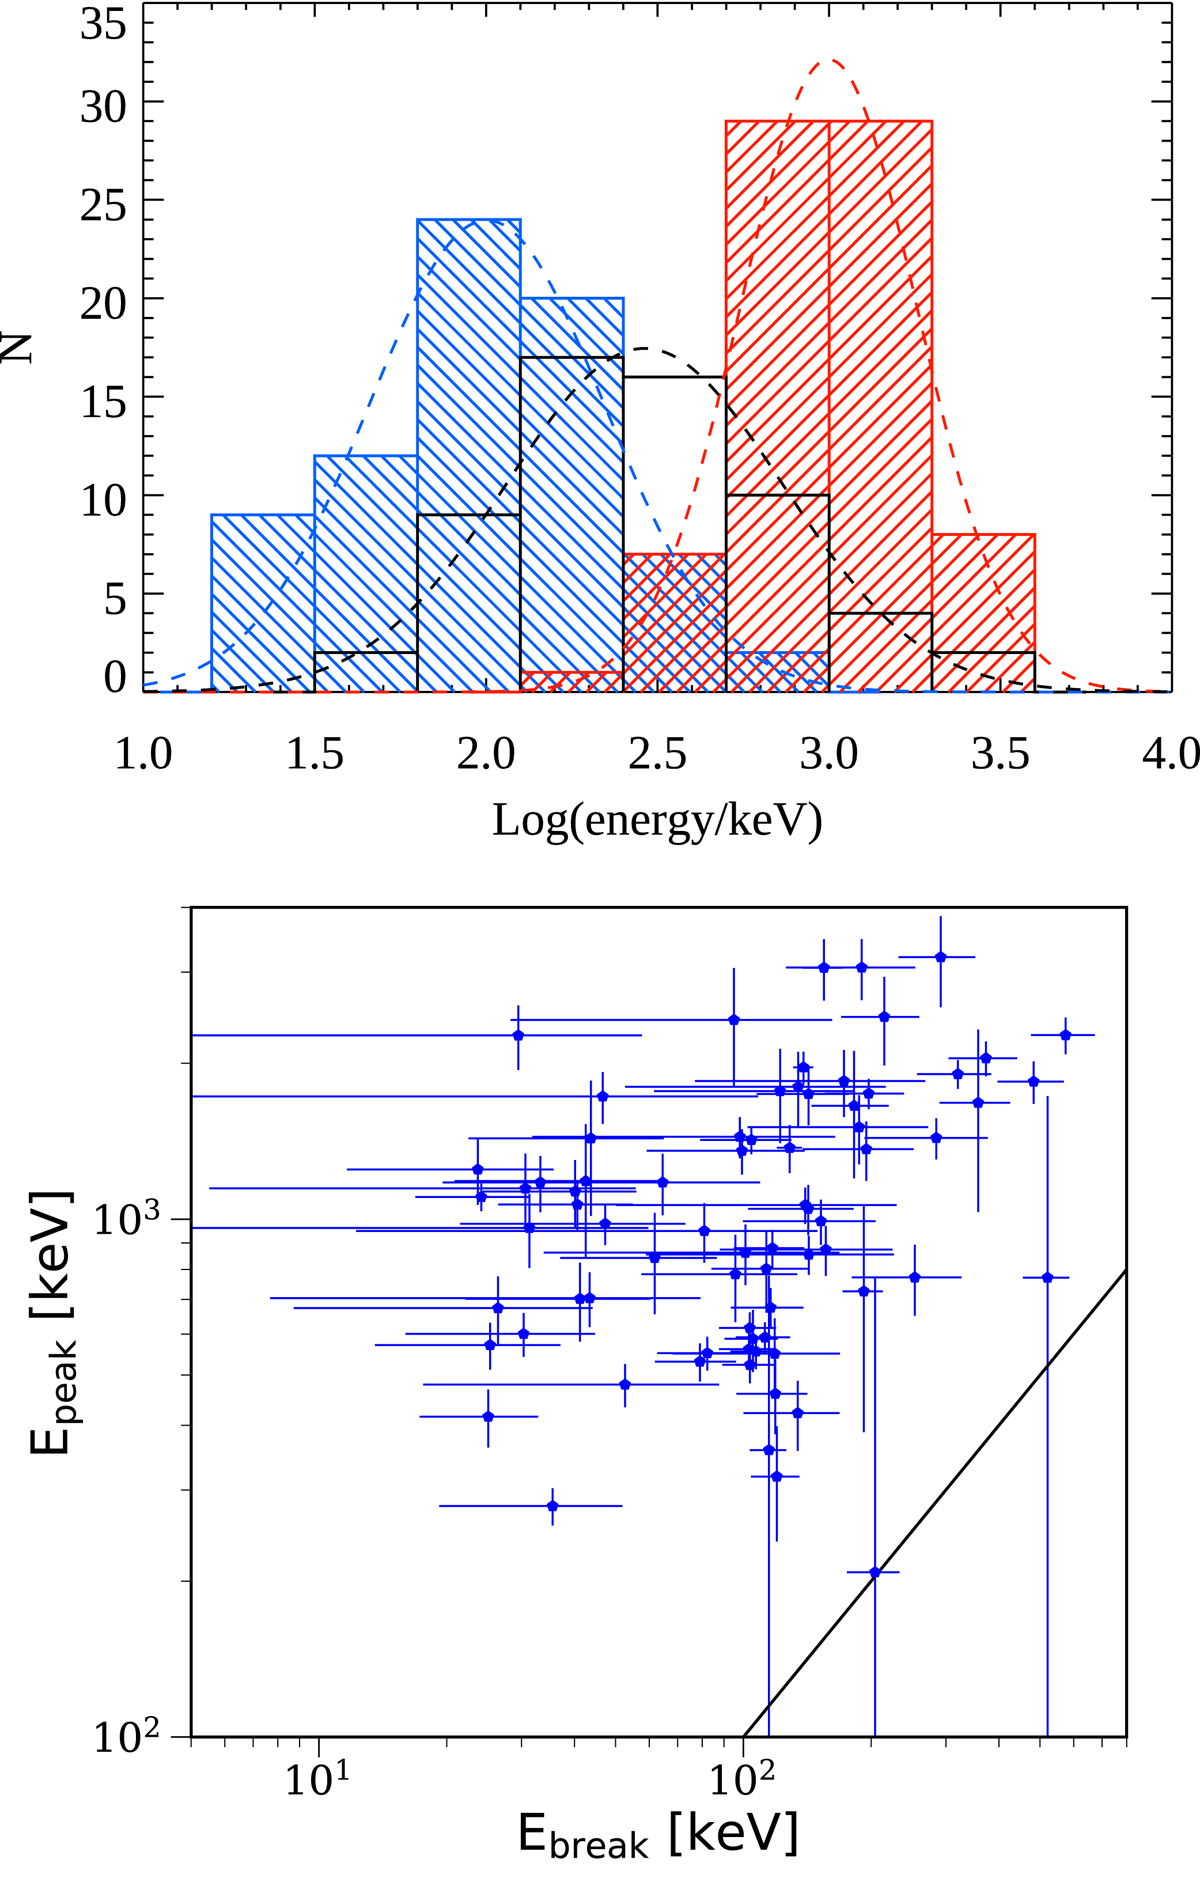
Long GRBs, time-resolved analysis. Top panel: distributions of the characteristic energies (Ebeak and Epeak for the 2SBPL (blue and red hatched histogram, respectively) and Epeak for the SBPL model (black empty histogram). Gaussian functions showing the central value and standard deviation for each distribution are overplotted to the histograms (with the same colour-coding). Bottom panel: Epeak versus Ebreak scatter plot (2SBPL model). The equality line is shown with a solid line.
Current usage metrics show cumulative count of Article Views (full-text article views including HTML views, PDF and ePub downloads, according to the available data) and Abstracts Views on Vision4Press platform.
Data correspond to usage on the plateform after 2015. The current usage metrics is available 48-96 hours after online publication and is updated daily on week days.
Initial download of the metrics may take a while.