Fig. 2.
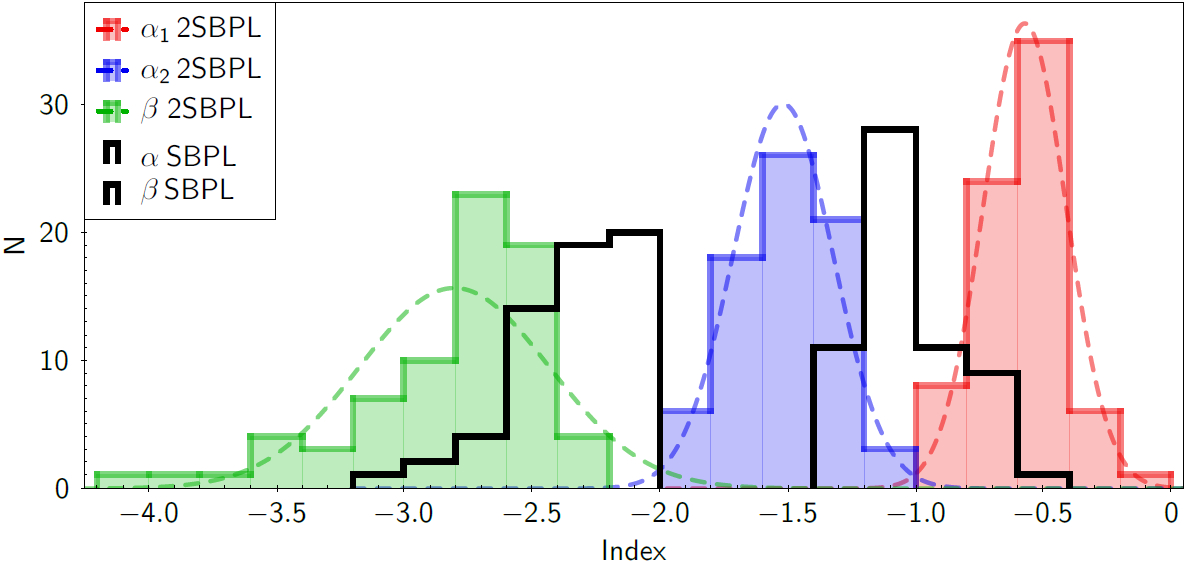
Long GRBs, time-resolved analysis: distribution of the spectral indices, according to the best fit model, for the time-resolved fits of the eight long GRBs showing a spectral break. The spectral indices α1, α2, and β of the 2SBPL model are shown with red, blue, and green filled histograms, respectively. Gaussian functions showing the central value and standard deviation of the distributions are overlapped to the histograms (colour-coded dashed curves). The black empty histograms represent the distributions of the two photon indices α and β of the SBPL model, for spectra where the SBPL is the best fit model.
Current usage metrics show cumulative count of Article Views (full-text article views including HTML views, PDF and ePub downloads, according to the available data) and Abstracts Views on Vision4Press platform.
Data correspond to usage on the plateform after 2015. The current usage metrics is available 48-96 hours after online publication and is updated daily on week days.
Initial download of the metrics may take a while.