Fig. 7.
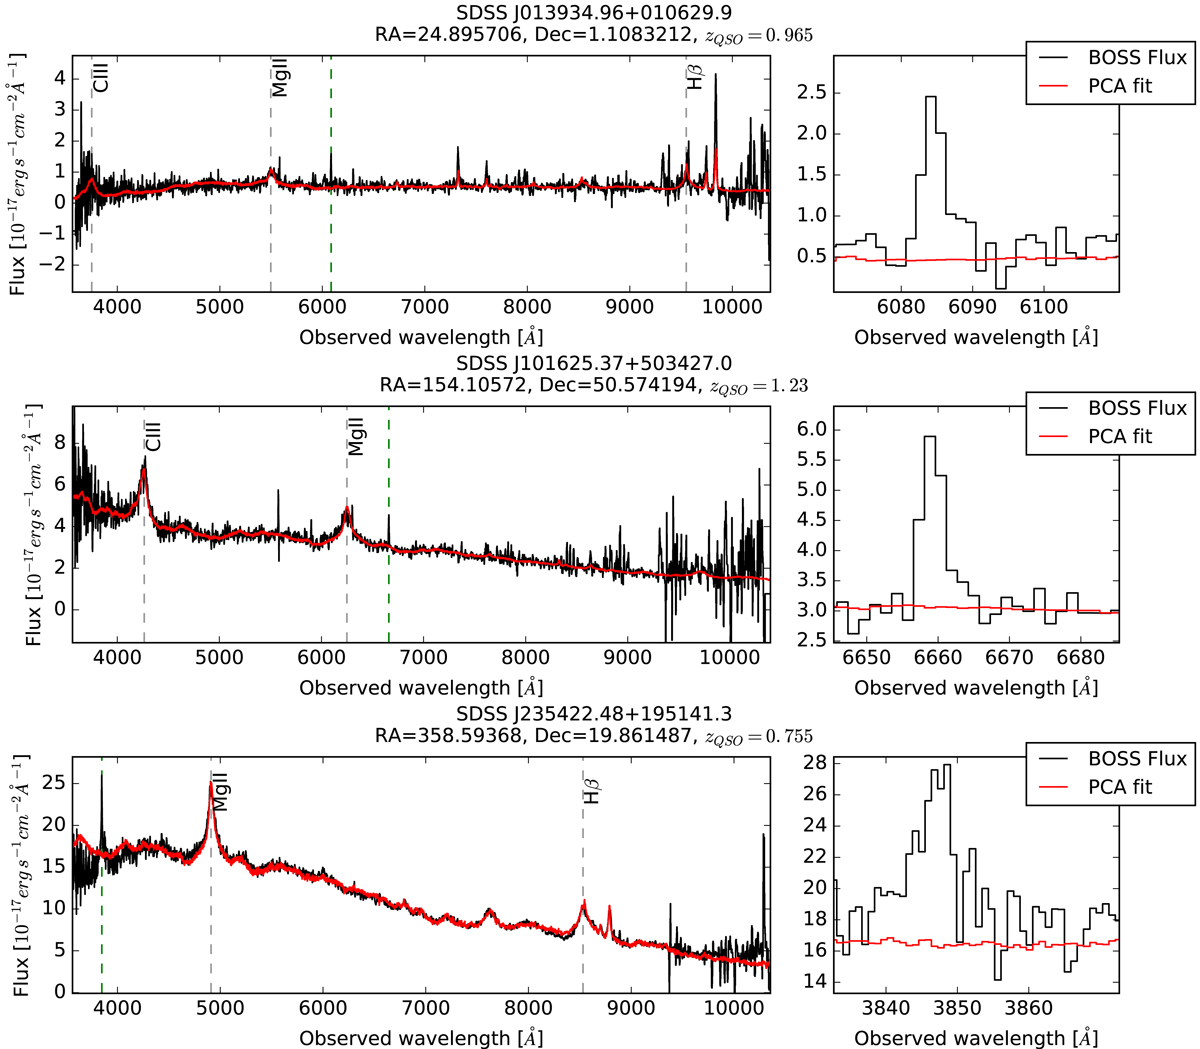
SDSS spectra of the QSO-LAE lensing systems candidates. Right panels: 5-pixel smoothed BOSS spectra (black) and QSO fitted PCA template (red). The detected extra emission line is indicated by the dashed green line. Left panels: zoom on the original spectra of the candidate lensed Lyman-α emission line. We note the asymmetric profile characteristic of Lyman-α.
Current usage metrics show cumulative count of Article Views (full-text article views including HTML views, PDF and ePub downloads, according to the available data) and Abstracts Views on Vision4Press platform.
Data correspond to usage on the plateform after 2015. The current usage metrics is available 48-96 hours after online publication and is updated daily on week days.
Initial download of the metrics may take a while.