Free Access
Fig. 4.
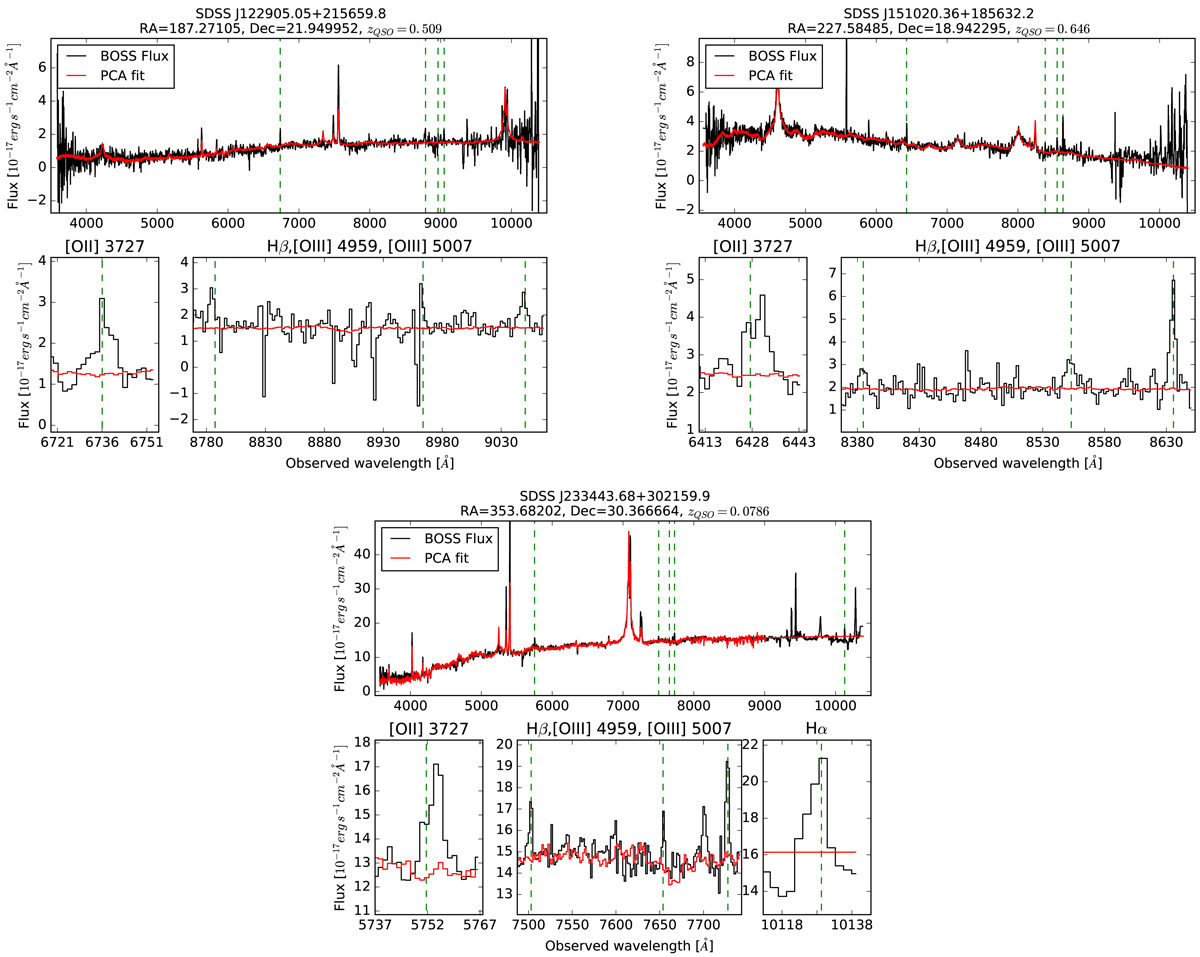
Spectroscopy of the three last QSO-ELG system candidates. Upper panels: five-pixel smoothed BOSS spectra (black) and QSO fitted PCA template (red). The location of the background galaxy emission lines are indicated by dashed green lines. Lower panels: zoom on the detected emission lines of the source galaxy.
Current usage metrics show cumulative count of Article Views (full-text article views including HTML views, PDF and ePub downloads, according to the available data) and Abstracts Views on Vision4Press platform.
Data correspond to usage on the plateform after 2015. The current usage metrics is available 48-96 hours after online publication and is updated daily on week days.
Initial download of the metrics may take a while.