Fig. 2.
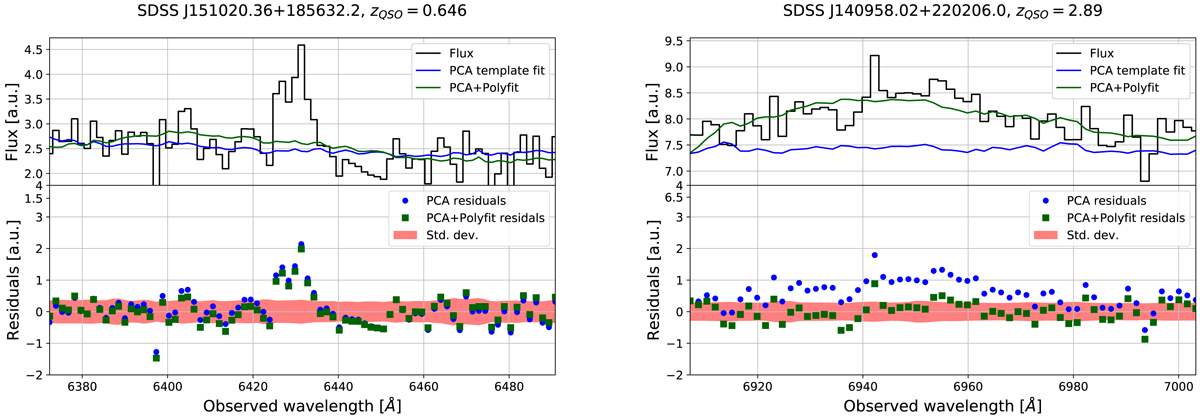
Comparison between a true emission line detection (right) and a false detection generated by an incorrect PCA template fit (left). However, locally fitting (and subtracting) a third order polynomial to a 40 Å section of the spectra around the line candidate is sufficient to remove continuum features unsubtracted by the PCA. The flux is in black, the PCA template in blue, and the polynomial fit in green. The lower panel showcases the SDSS spectrograph 1σ error array in red, and the residuals from both fits in the same colour code. The residuals of the PCA fit are removed and no longer result in a detection, whereas the thin emission line is still clearly detected.
Current usage metrics show cumulative count of Article Views (full-text article views including HTML views, PDF and ePub downloads, according to the available data) and Abstracts Views on Vision4Press platform.
Data correspond to usage on the plateform after 2015. The current usage metrics is available 48-96 hours after online publication and is updated daily on week days.
Initial download of the metrics may take a while.