Fig. 1.
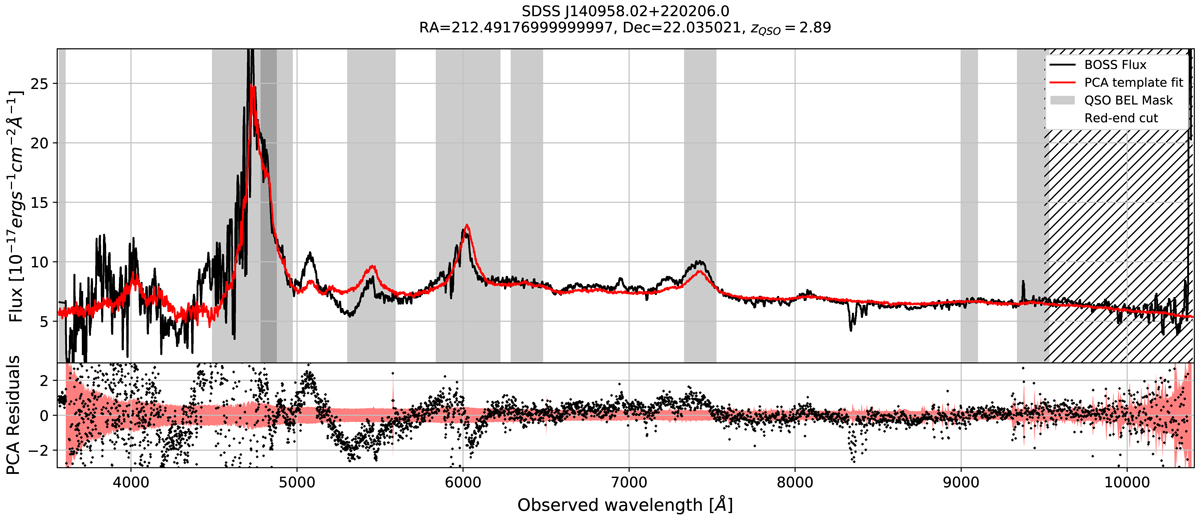
Typical example of a large misfit between the SDSS pipeline PCA template and the QSO spectra. The grey shaded regions are the masked QSO emission line regions of Table B.1 and sky emission lines of Table B.2. The measured flux is in black, the pipeline PCA template spectrum in red. The lower panel shows the residuals from the PCA template fit subtraction in black and the SDSS spectrograph 1σ error array in red. The large residuals, even outside masked regions, create many false positives when searching for extra emission lines from a different object in the QSO spectrum.
Current usage metrics show cumulative count of Article Views (full-text article views including HTML views, PDF and ePub downloads, according to the available data) and Abstracts Views on Vision4Press platform.
Data correspond to usage on the plateform after 2015. The current usage metrics is available 48-96 hours after online publication and is updated daily on week days.
Initial download of the metrics may take a while.