Fig. 4.
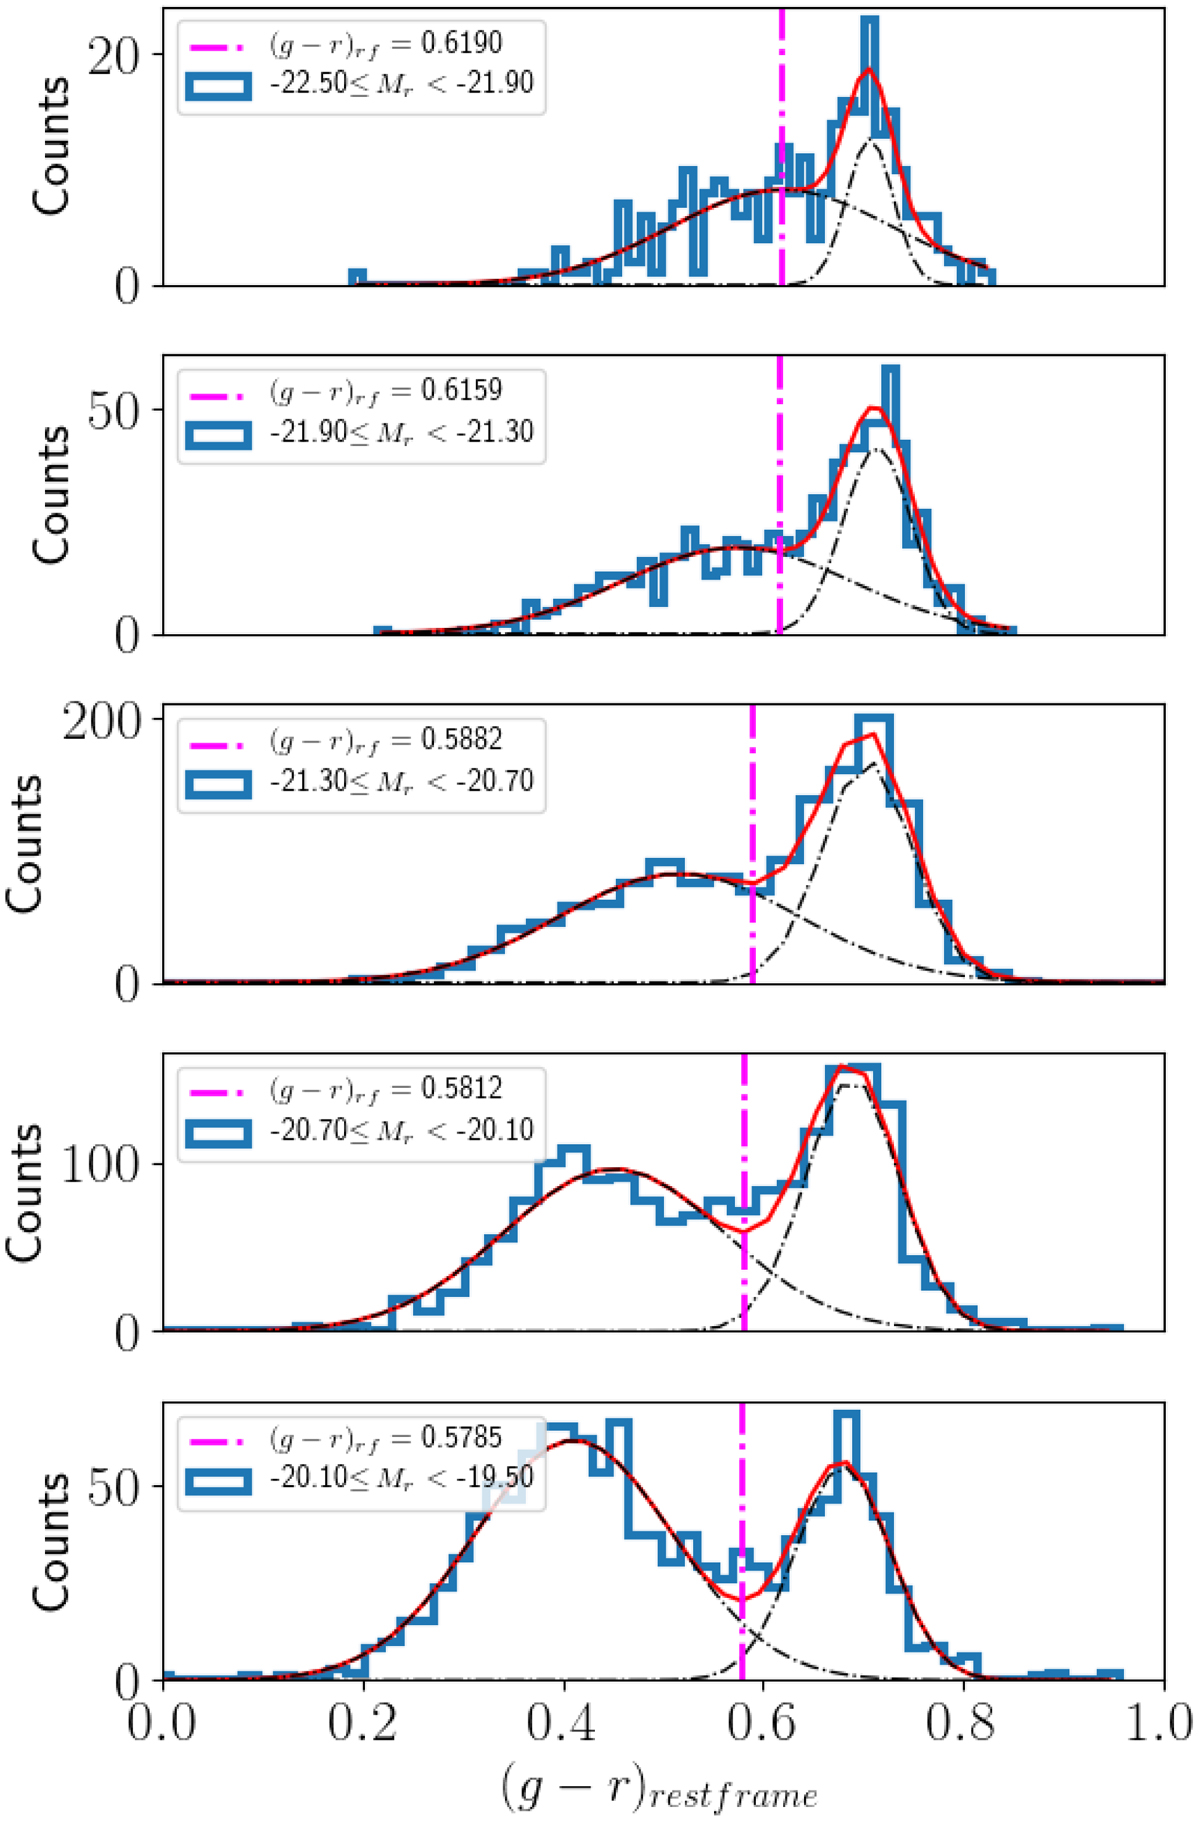
Rest-frame (g − r) colour distributions in five absolute magnitude bins for galaxies at 0.1 ≤ z < 0.2. The red curve shows the double-Gaussian fit performed on the distributions and the single Gaussians are represented with the black dashed line. The magenta vertical lines indicate the local minima in the valley between the two Gaussian peaks, and define the separation between the red sequence and blue cloud.
Current usage metrics show cumulative count of Article Views (full-text article views including HTML views, PDF and ePub downloads, according to the available data) and Abstracts Views on Vision4Press platform.
Data correspond to usage on the plateform after 2015. The current usage metrics is available 48-96 hours after online publication and is updated daily on week days.
Initial download of the metrics may take a while.