Fig. C.1.
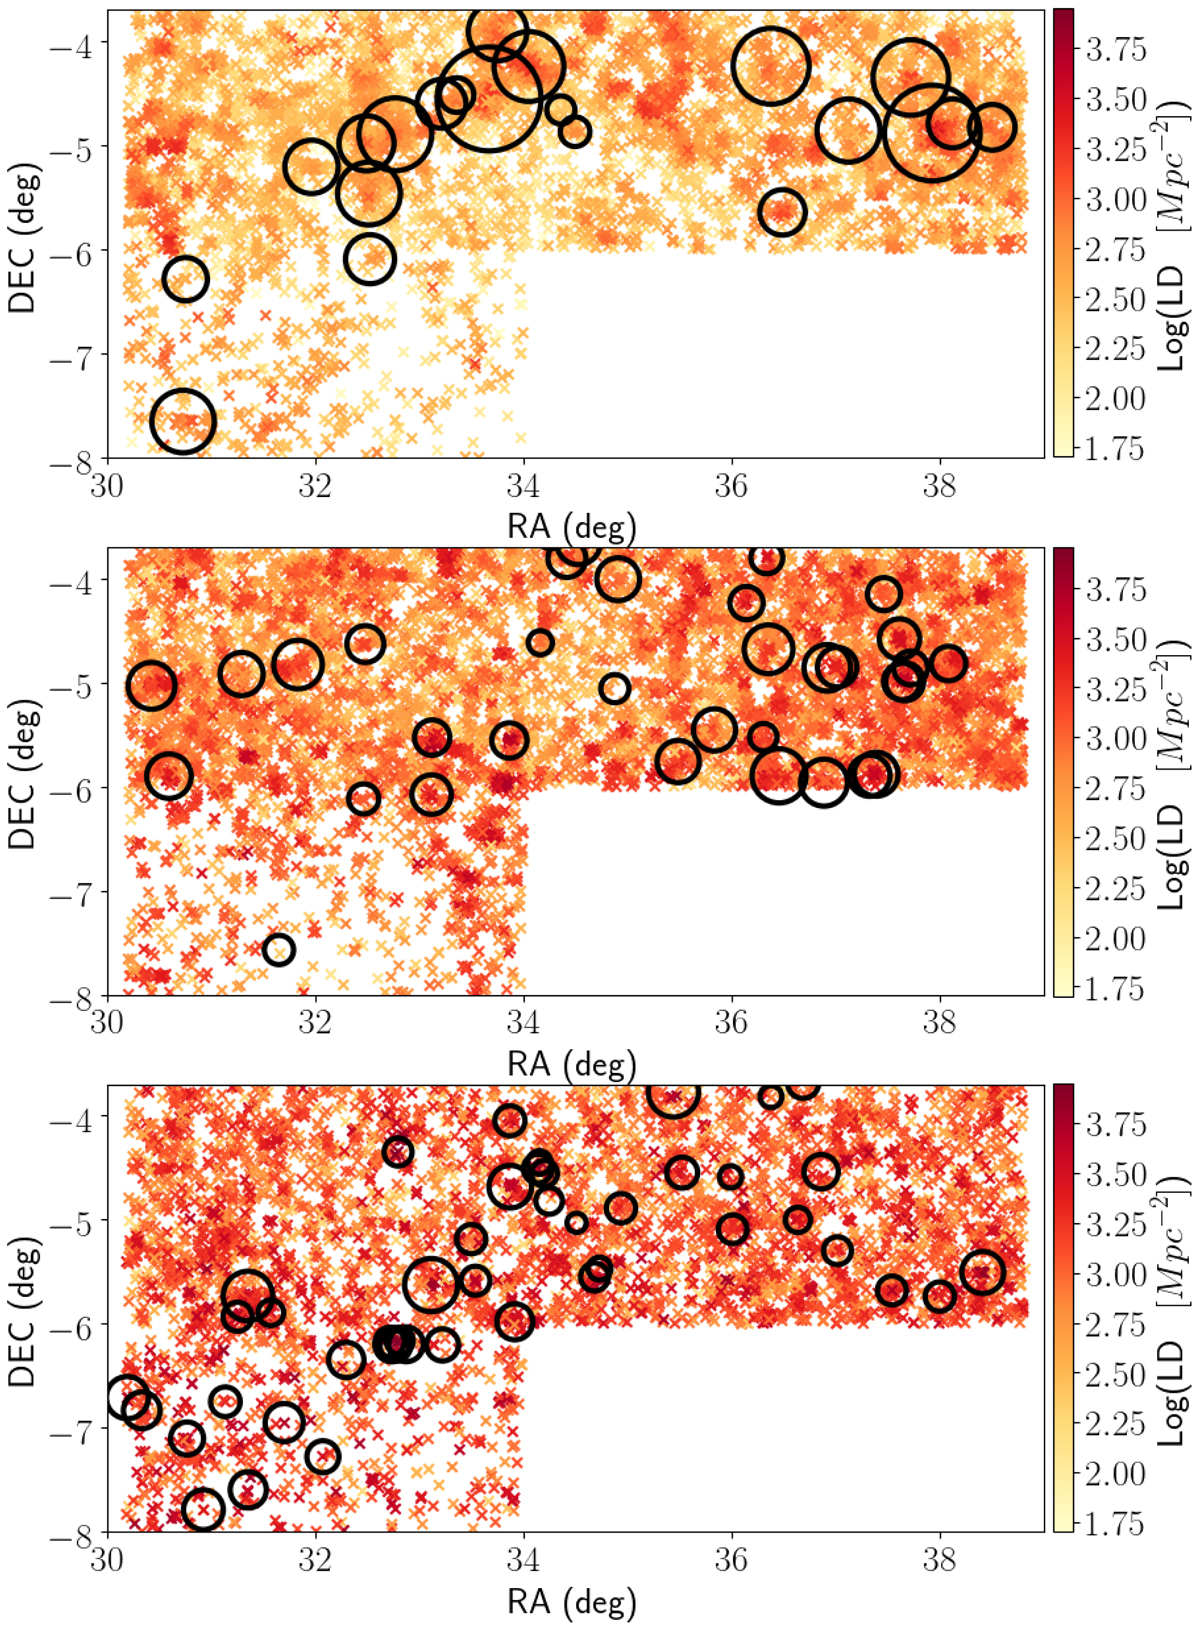
Spatial distribution in the sky of the spectrophotometric magnitude limited sample. Data points are colour coded according to their log(LD), after a sigma-clipping has been performed on the parent distribution. From the top to bottom panel the represented redshift bins are 0.1 ≤ z < 0.2, 0.2 ≤ z < 0.3, 0.3 ≤ z ≤ 0.5, respectively. Each panel contains the 3r200 extensions of the clusters at the redshift of the bin, represented with black empty circles.
Current usage metrics show cumulative count of Article Views (full-text article views including HTML views, PDF and ePub downloads, according to the available data) and Abstracts Views on Vision4Press platform.
Data correspond to usage on the plateform after 2015. The current usage metrics is available 48-96 hours after online publication and is updated daily on week days.
Initial download of the metrics may take a while.