Fig. 12.
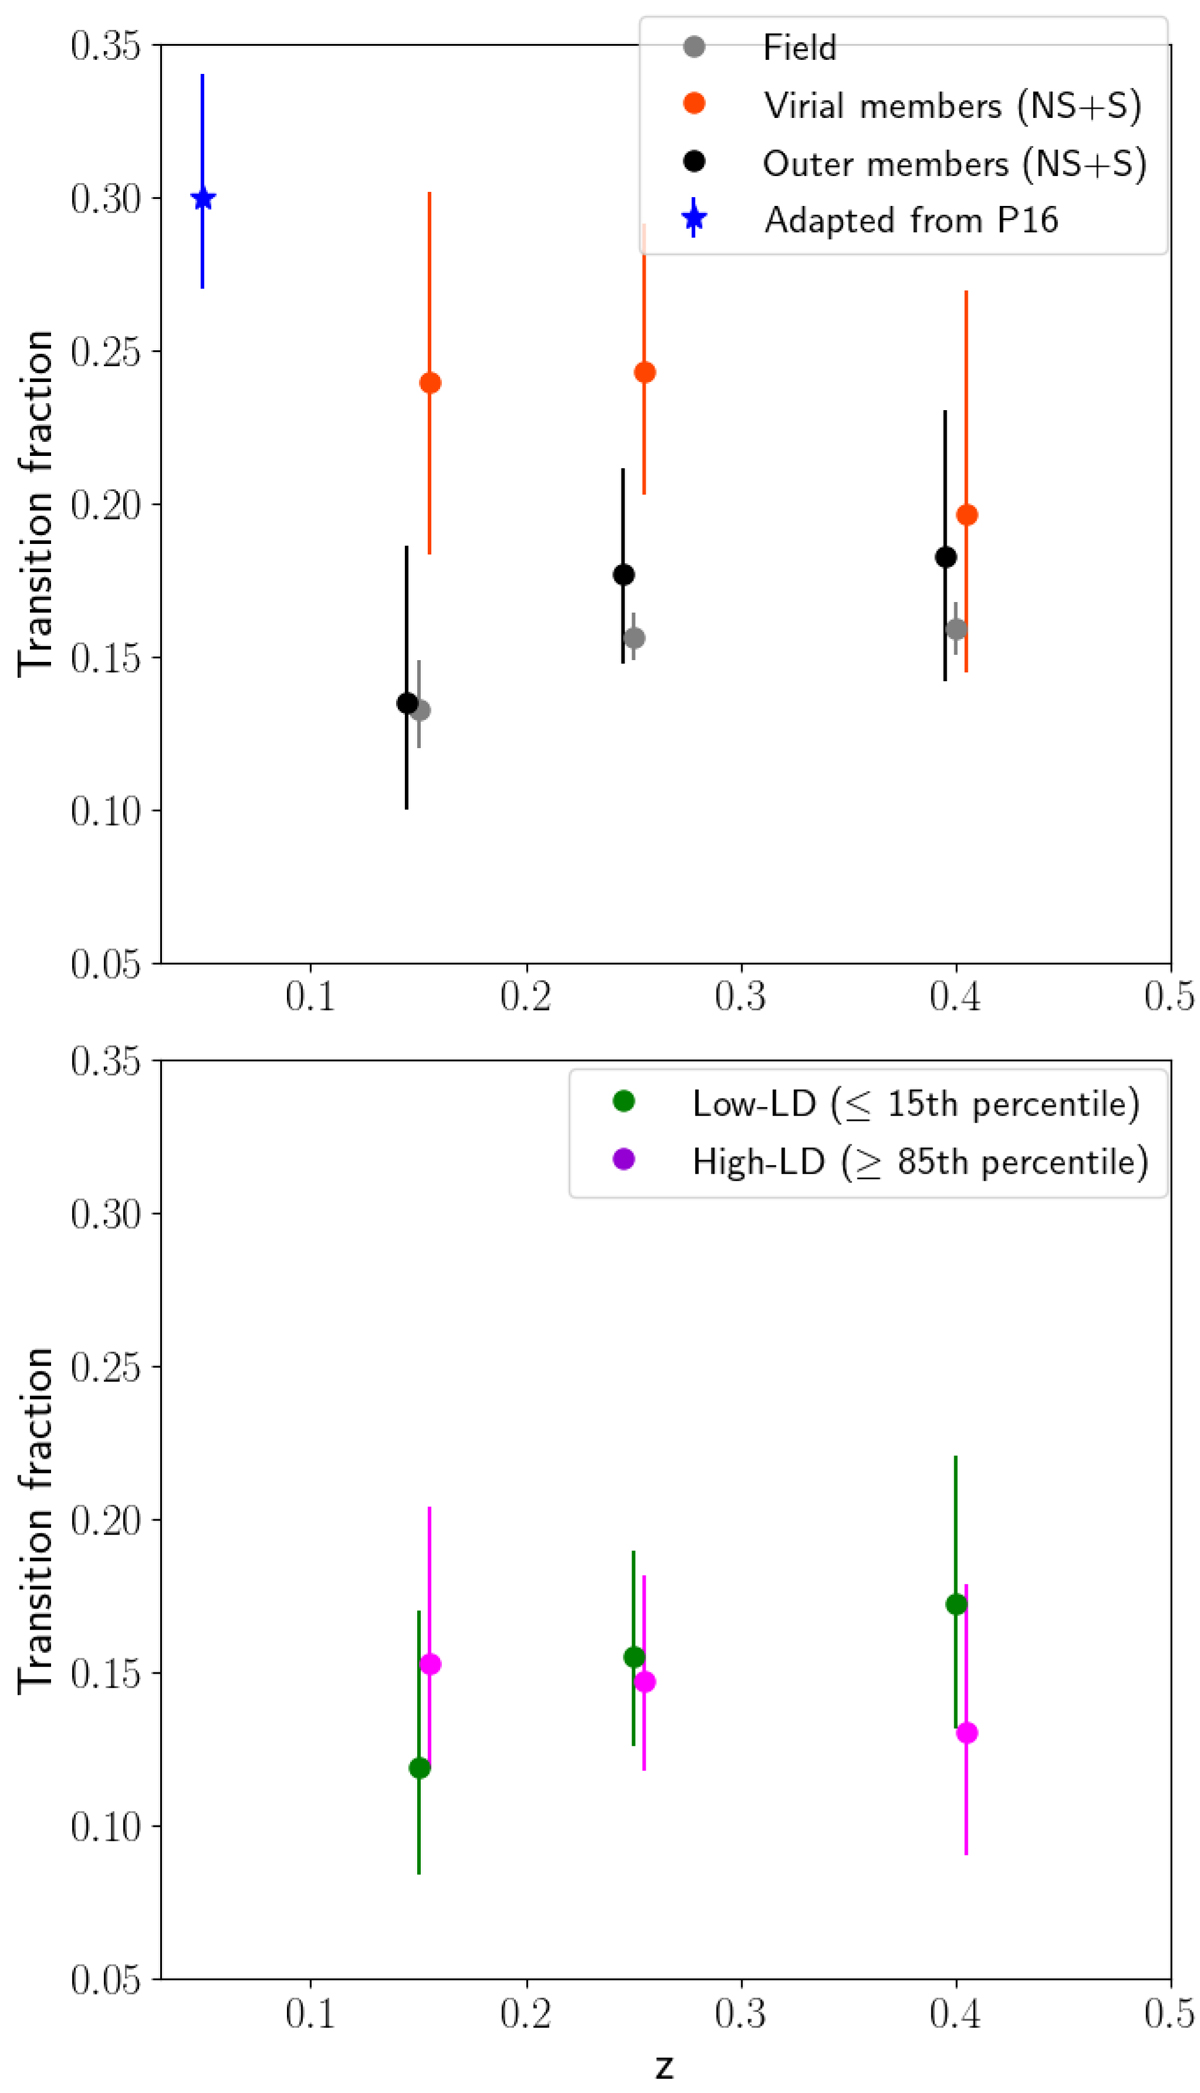
Fraction of galaxies in transition at 0.1 ≤ z ≤ 0.5 considering the global (top) and local (bottom) parametrisation Fractions are computed for logM/M⊙ ≥ 10.8, the stellar mass completeness limit at 0.3 ≤ z ≤ 0.5. Error bars on the fractions are computed via bootstrapping. In the top panel, the blue star represents the fraction of transition galaxies in the local universe, adapted from Paccagnella et al. (2016).
Current usage metrics show cumulative count of Article Views (full-text article views including HTML views, PDF and ePub downloads, according to the available data) and Abstracts Views on Vision4Press platform.
Data correspond to usage on the plateform after 2015. The current usage metrics is available 48-96 hours after online publication and is updated daily on week days.
Initial download of the metrics may take a while.