Fig. 6.
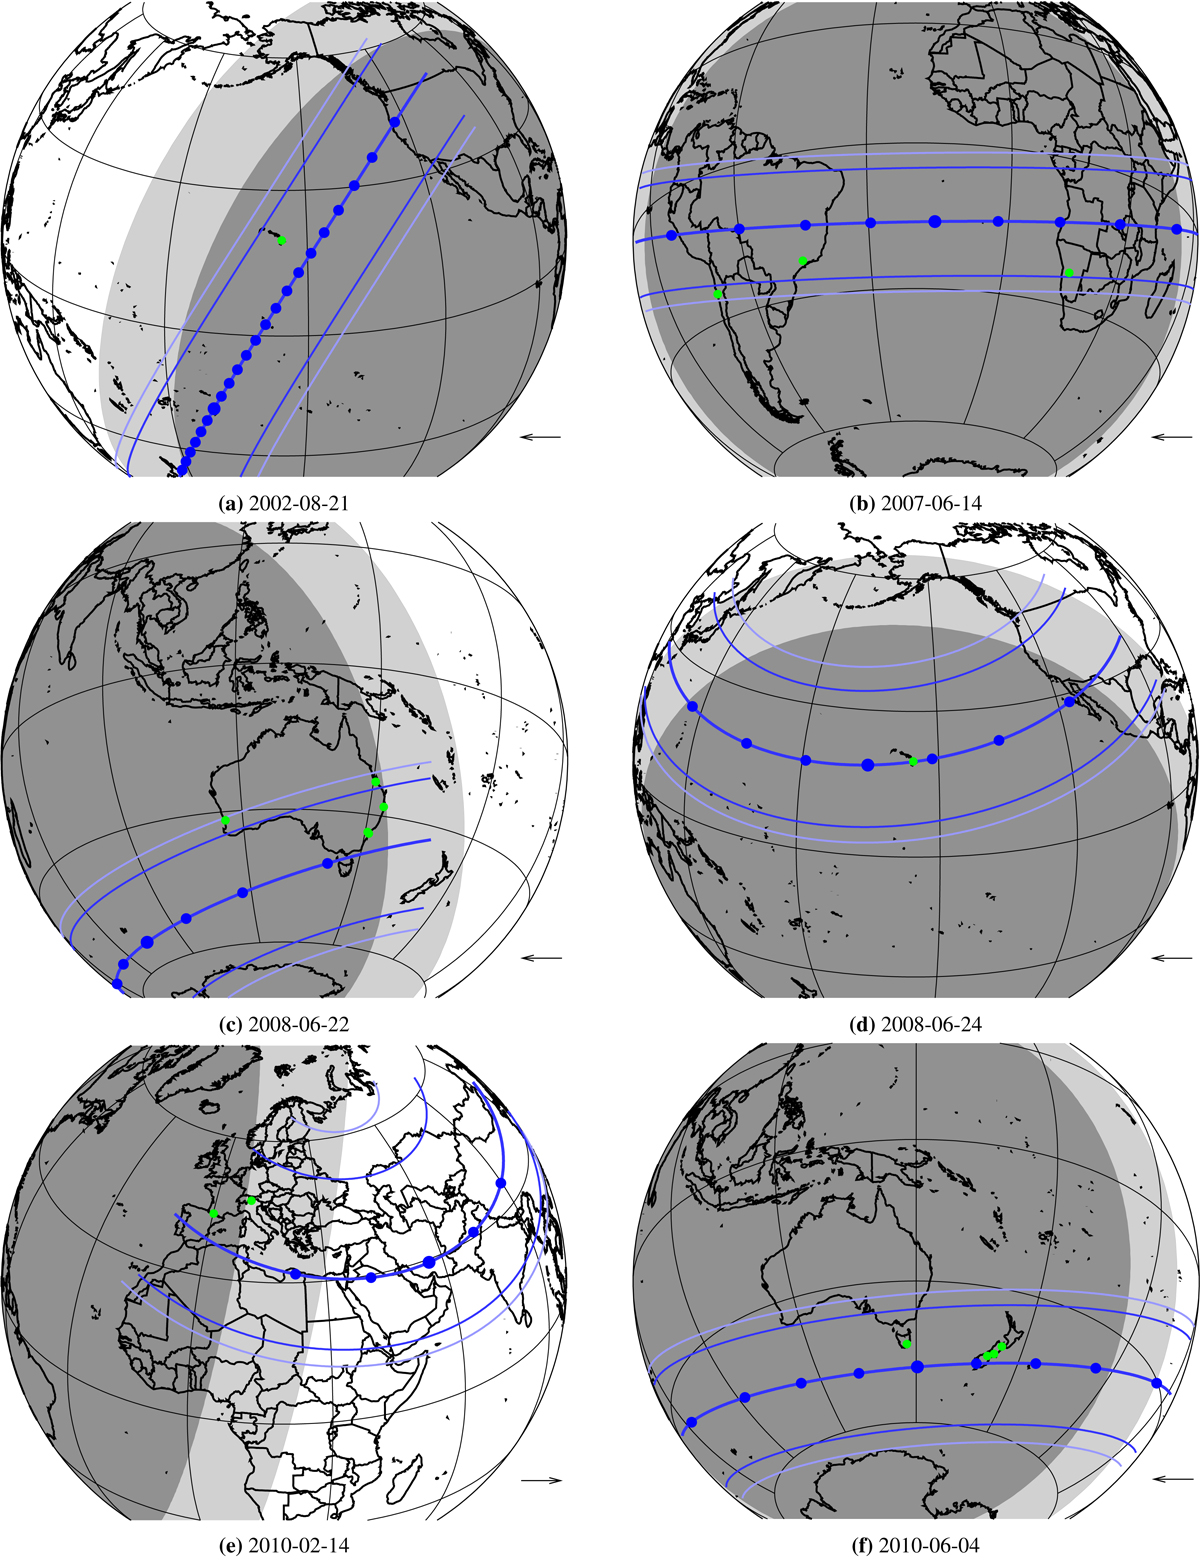
Reconstruction of Pluto’s shadow trajectories on Earth for occultations observed from 2002 to 2016; see details in Meza et al. (2019). The bullets on the shadow central line are plotted every minute, and the black arrow represents the shadow motion direction (see arrow at lower right corner). The dark and light blue thinner lines are the shadow limits corresponding the stellar half-light level and 1% stellar drop level (the practical detection limit), respectively. The green bullets correspond to the sites with positive detection used in the fit. Areas in dark grey correspond to full night (Sun elevation below −18°) and areas in light grey correspond to astronomical twilight (Sun elevation between −18° and 0°), while daytime regions are in white.
Current usage metrics show cumulative count of Article Views (full-text article views including HTML views, PDF and ePub downloads, according to the available data) and Abstracts Views on Vision4Press platform.
Data correspond to usage on the plateform after 2015. The current usage metrics is available 48-96 hours after online publication and is updated daily on week days.
Initial download of the metrics may take a while.