Fig. 2.
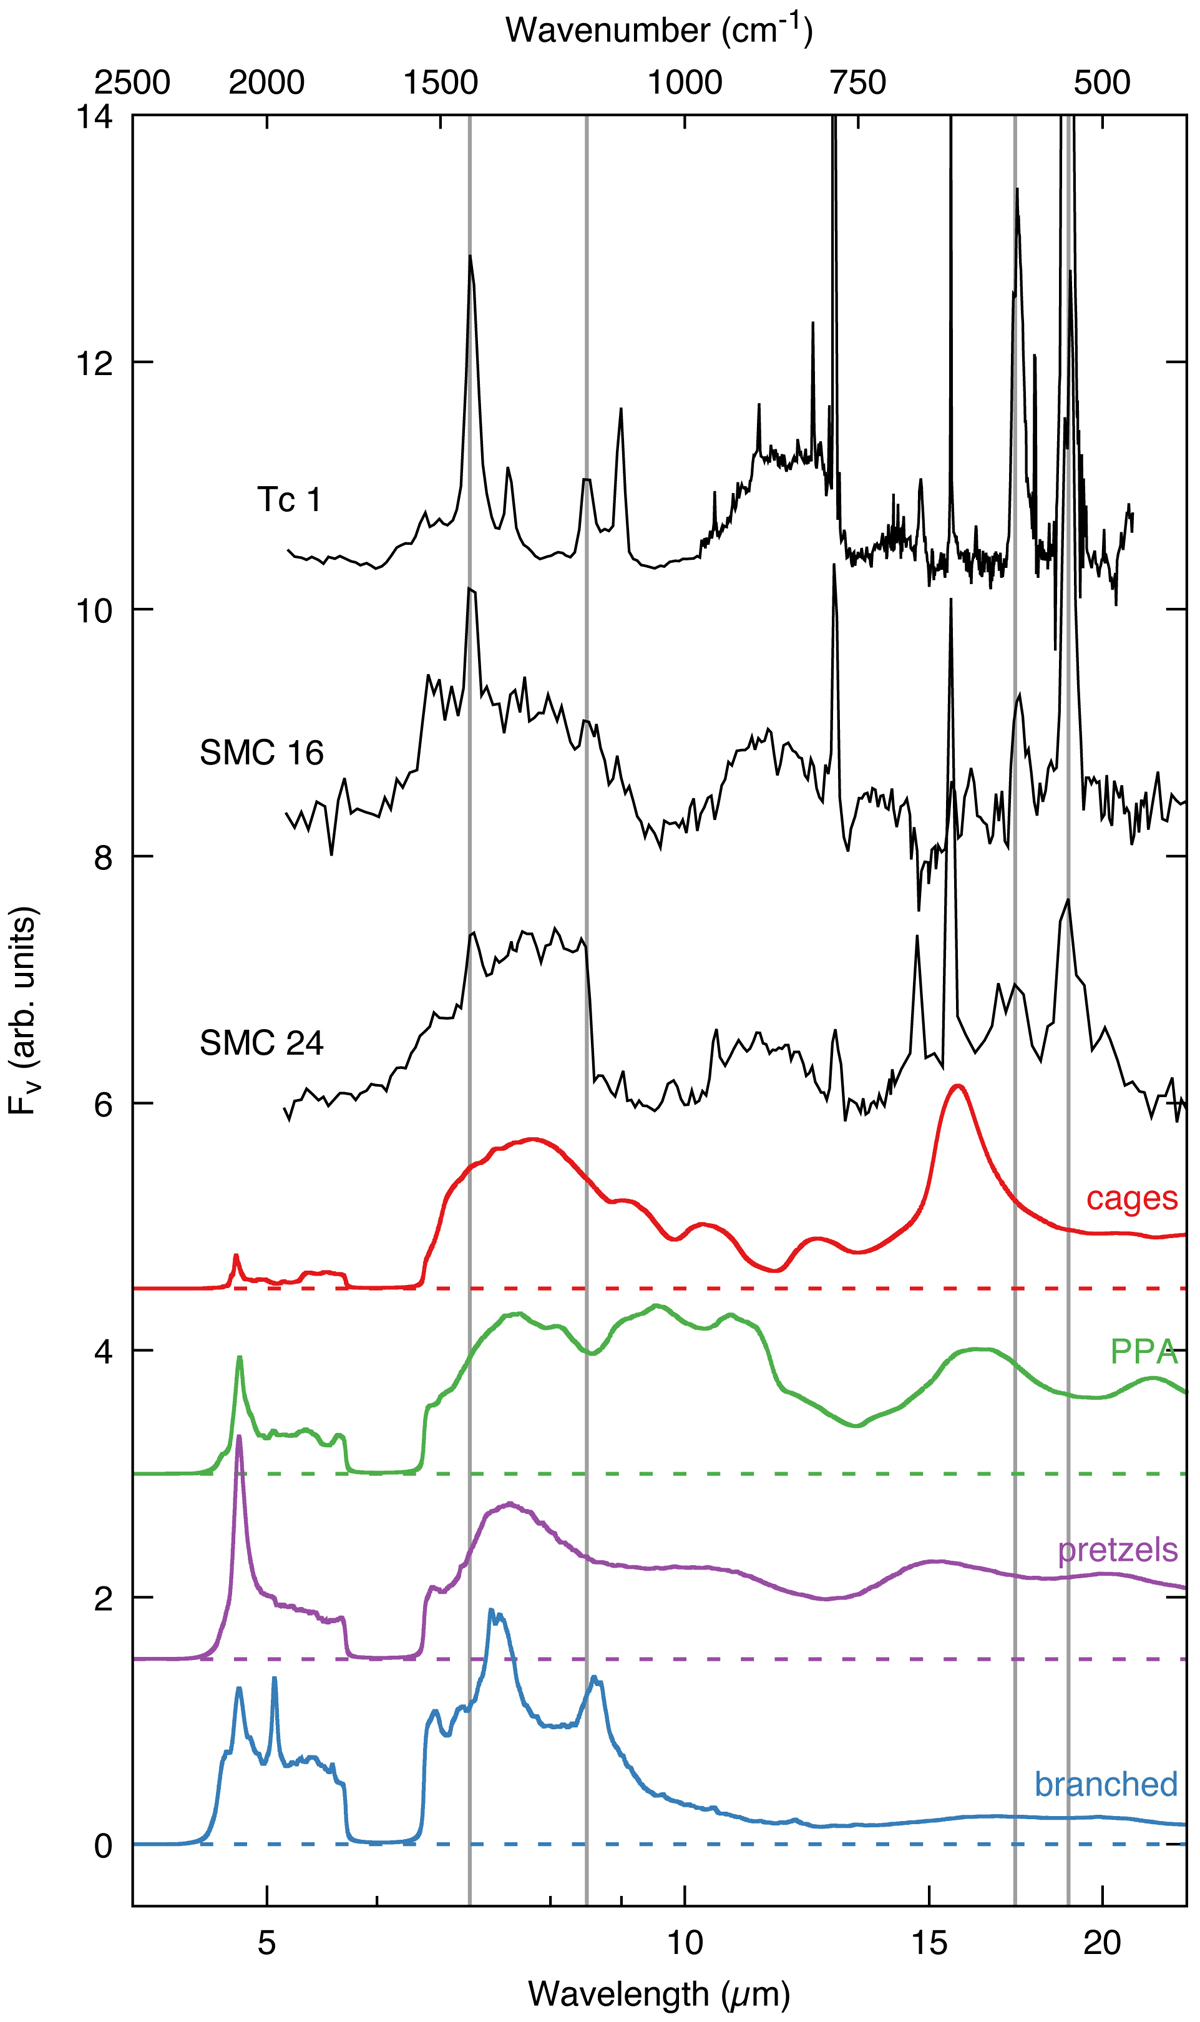
Spitzer astronomical data observed for the Tc 1 and SMP SMC 16 (García-Hernández et al. 2010) and SMP SMC 24 (García-Hernández et al. 2011a) planetary nebulae (black curves) and IR spectra calculated for the cages, PPAs, pretzels, and branched structures families (red, green, purple, and blue curves, respectively). The four vertical lines mark the IR active lines of buckminsterfullerene (Krätschmer et al. 1990)
Current usage metrics show cumulative count of Article Views (full-text article views including HTML views, PDF and ePub downloads, according to the available data) and Abstracts Views on Vision4Press platform.
Data correspond to usage on the plateform after 2015. The current usage metrics is available 48-96 hours after online publication and is updated daily on week days.
Initial download of the metrics may take a while.