Fig. 4.
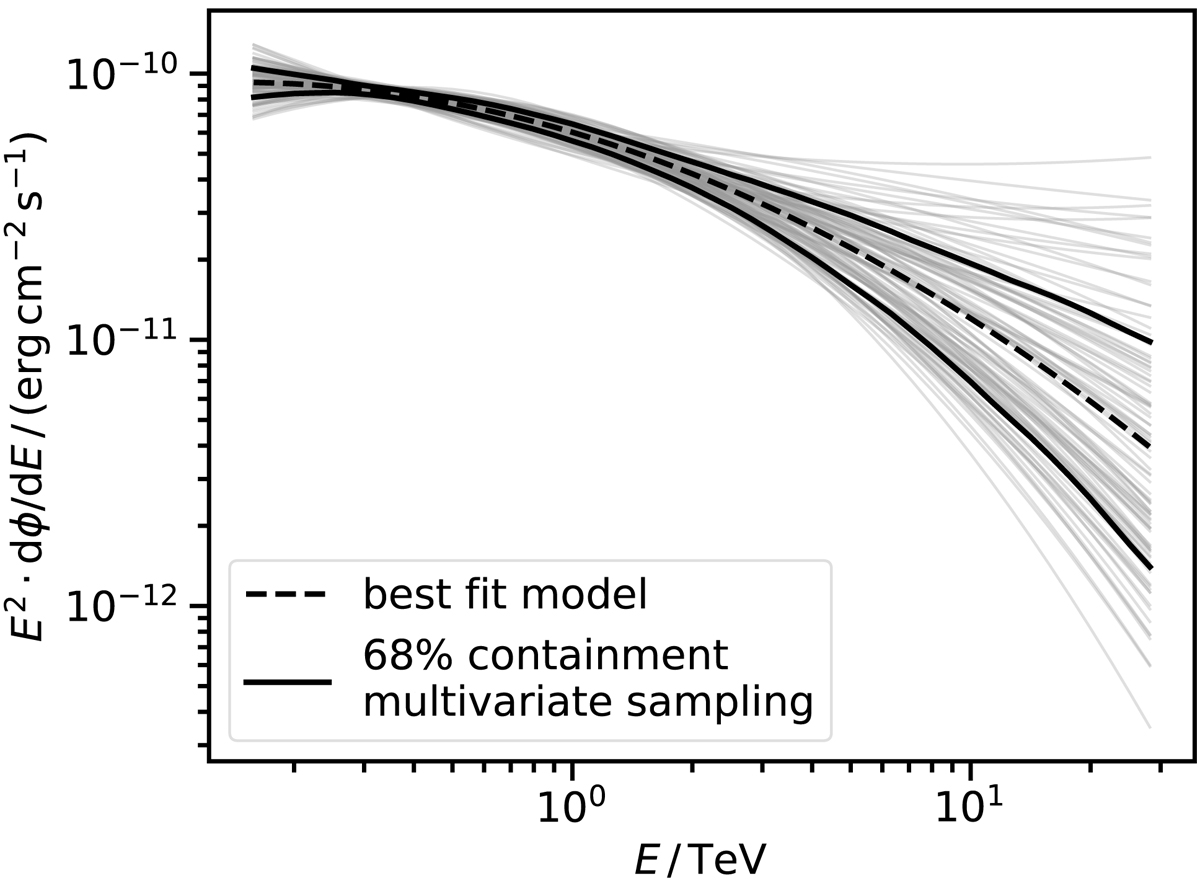
Error estimation methods for the measured SED using the VERITAS dataset, as the example case. The solid black lines indicate the upper and lower limits of the error band estimated with the multivariate sampling. These lines represent the 68% containment of 500 spectral realizations (100 shown as grey lines) whose parameters are sampled from a multivariate distribution defined by the fit results.
Current usage metrics show cumulative count of Article Views (full-text article views including HTML views, PDF and ePub downloads, according to the available data) and Abstracts Views on Vision4Press platform.
Data correspond to usage on the plateform after 2015. The current usage metrics is available 48-96 hours after online publication and is updated daily on week days.
Initial download of the metrics may take a while.