Fig. 2.
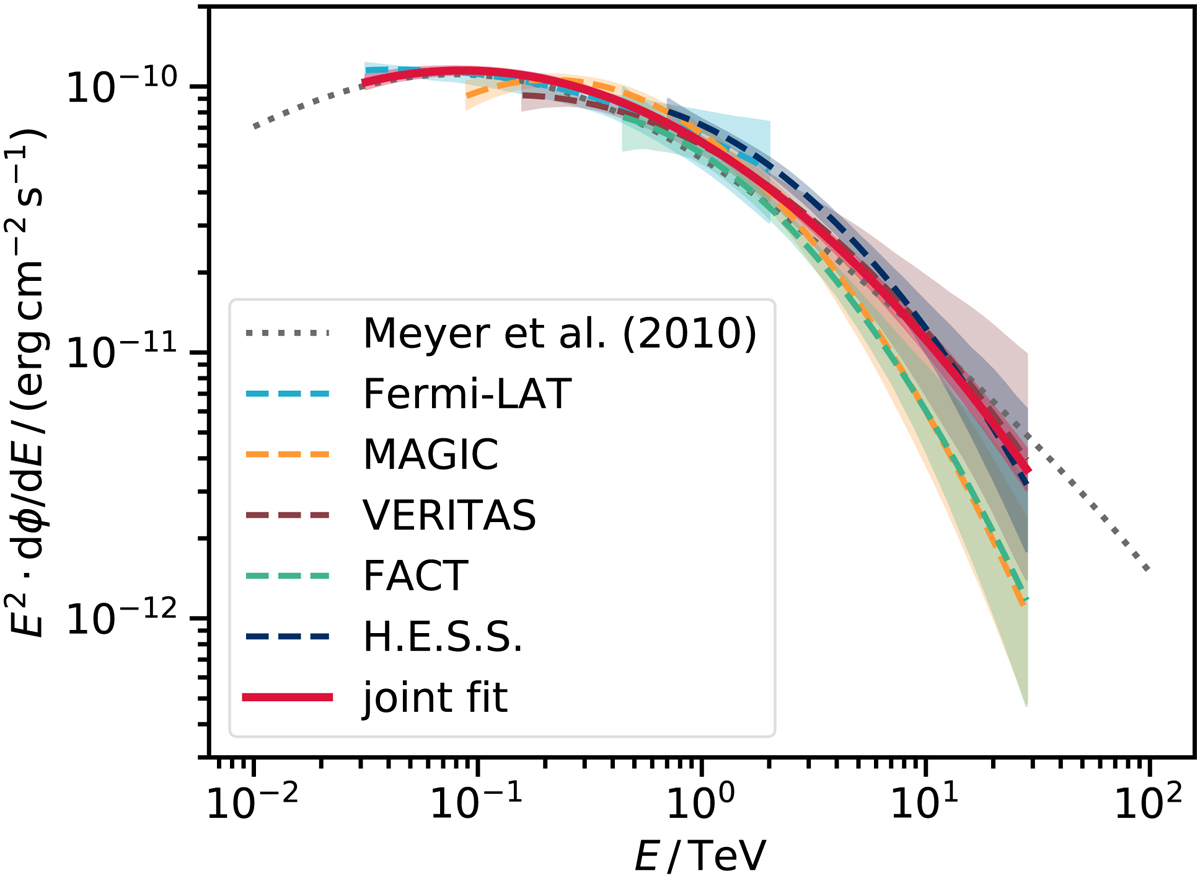
Crab nebula SED for individual instrument fits and from the joint fit. Single-instrument results are represented with dashed lines, the fit of all the datasets together, labelled as joint, is represented as a thick, solid red line. The shaded areas represent the SED error bands whose calculation is explained in Sect. 3.2. The dotted line shows the model in Meyer et al. (2010).
Current usage metrics show cumulative count of Article Views (full-text article views including HTML views, PDF and ePub downloads, according to the available data) and Abstracts Views on Vision4Press platform.
Data correspond to usage on the plateform after 2015. The current usage metrics is available 48-96 hours after online publication and is updated daily on week days.
Initial download of the metrics may take a while.