Fig. A.2.
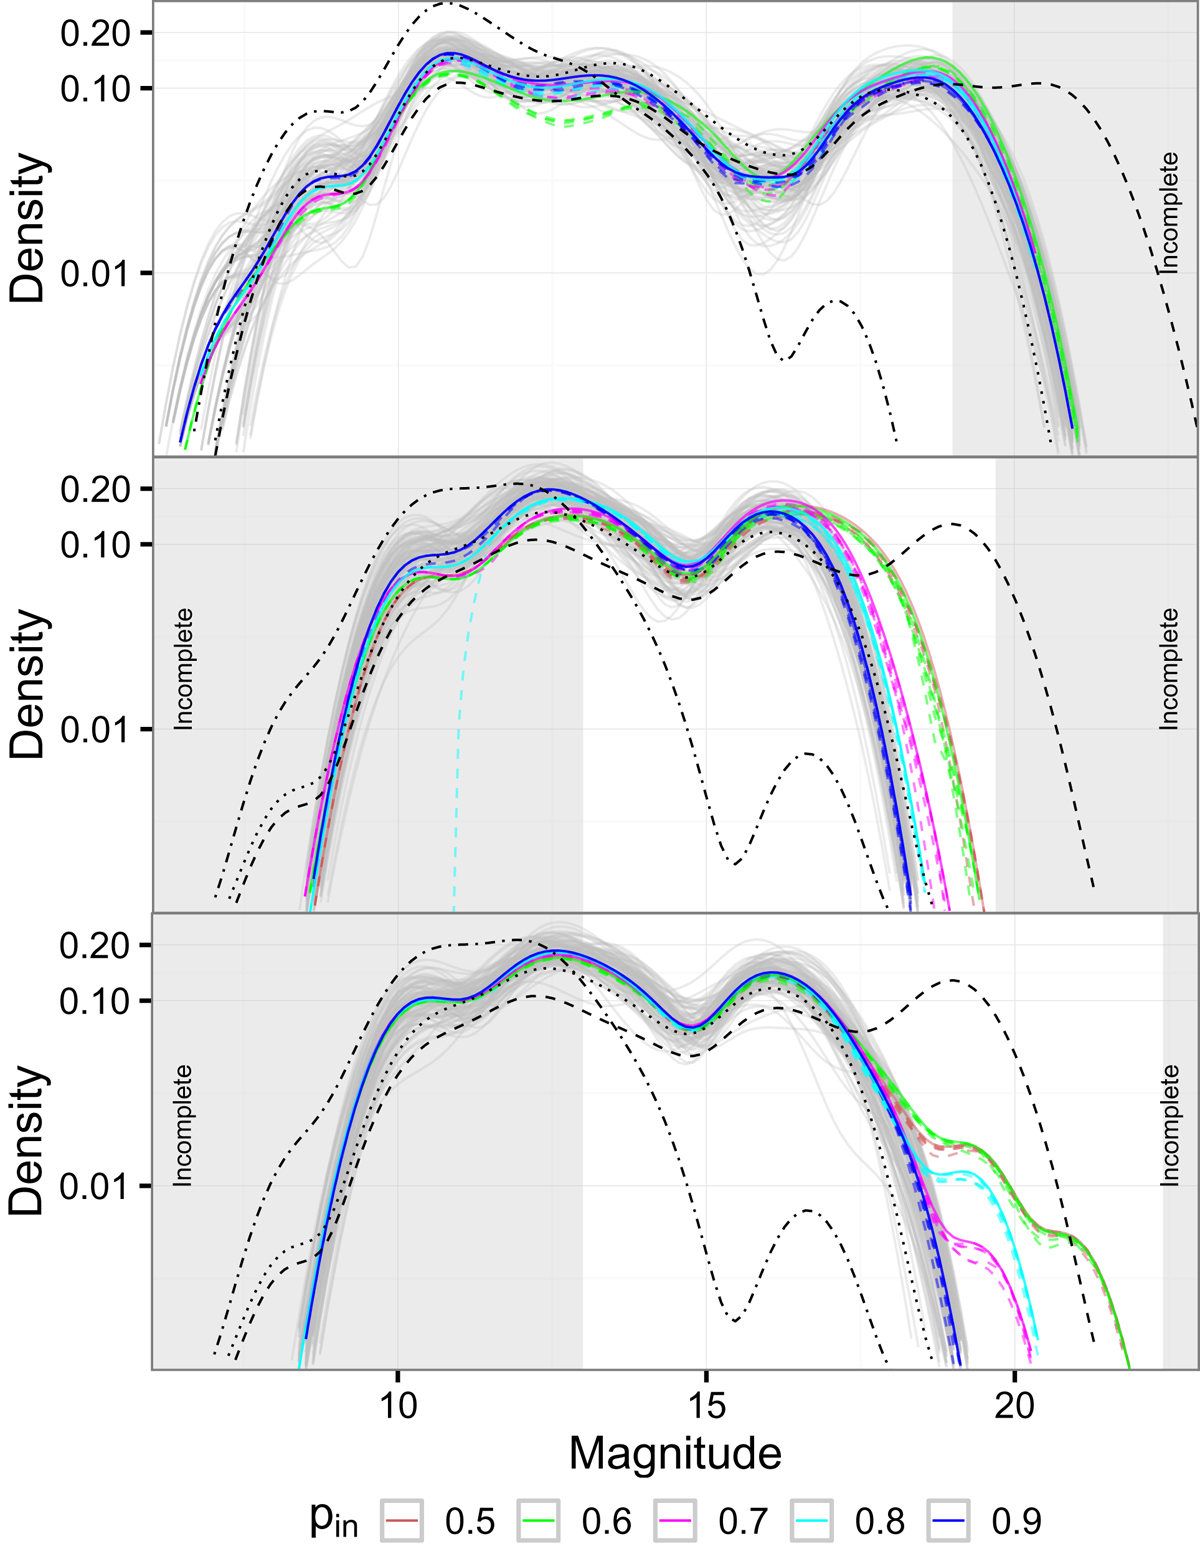
Magnitude distributions computed from the candidate members recovered by the GDR2 (top panel at BP band), DANCe (middle panel at i band) and DANCe Central (bottom panel at i band) classifiers at different pin values (colour code). Also shown are the magnitude distributions: (i) of our candidate members corrected by the PPV (dashed lines), (ii) of bootstrap realizations from the candidate members at the higher pin value (grey lines), and (iii) of the candidate members from Curtis et al. (2013), Gaia Collaboration (2018a), and Cantat-Gaudin et al. (2018a), in dot-dashed, dashed, and dotted lines, respectively.
Current usage metrics show cumulative count of Article Views (full-text article views including HTML views, PDF and ePub downloads, according to the available data) and Abstracts Views on Vision4Press platform.
Data correspond to usage on the plateform after 2015. The current usage metrics is available 48-96 hours after online publication and is updated daily on week days.
Initial download of the metrics may take a while.