Open Access
Fig. 2.
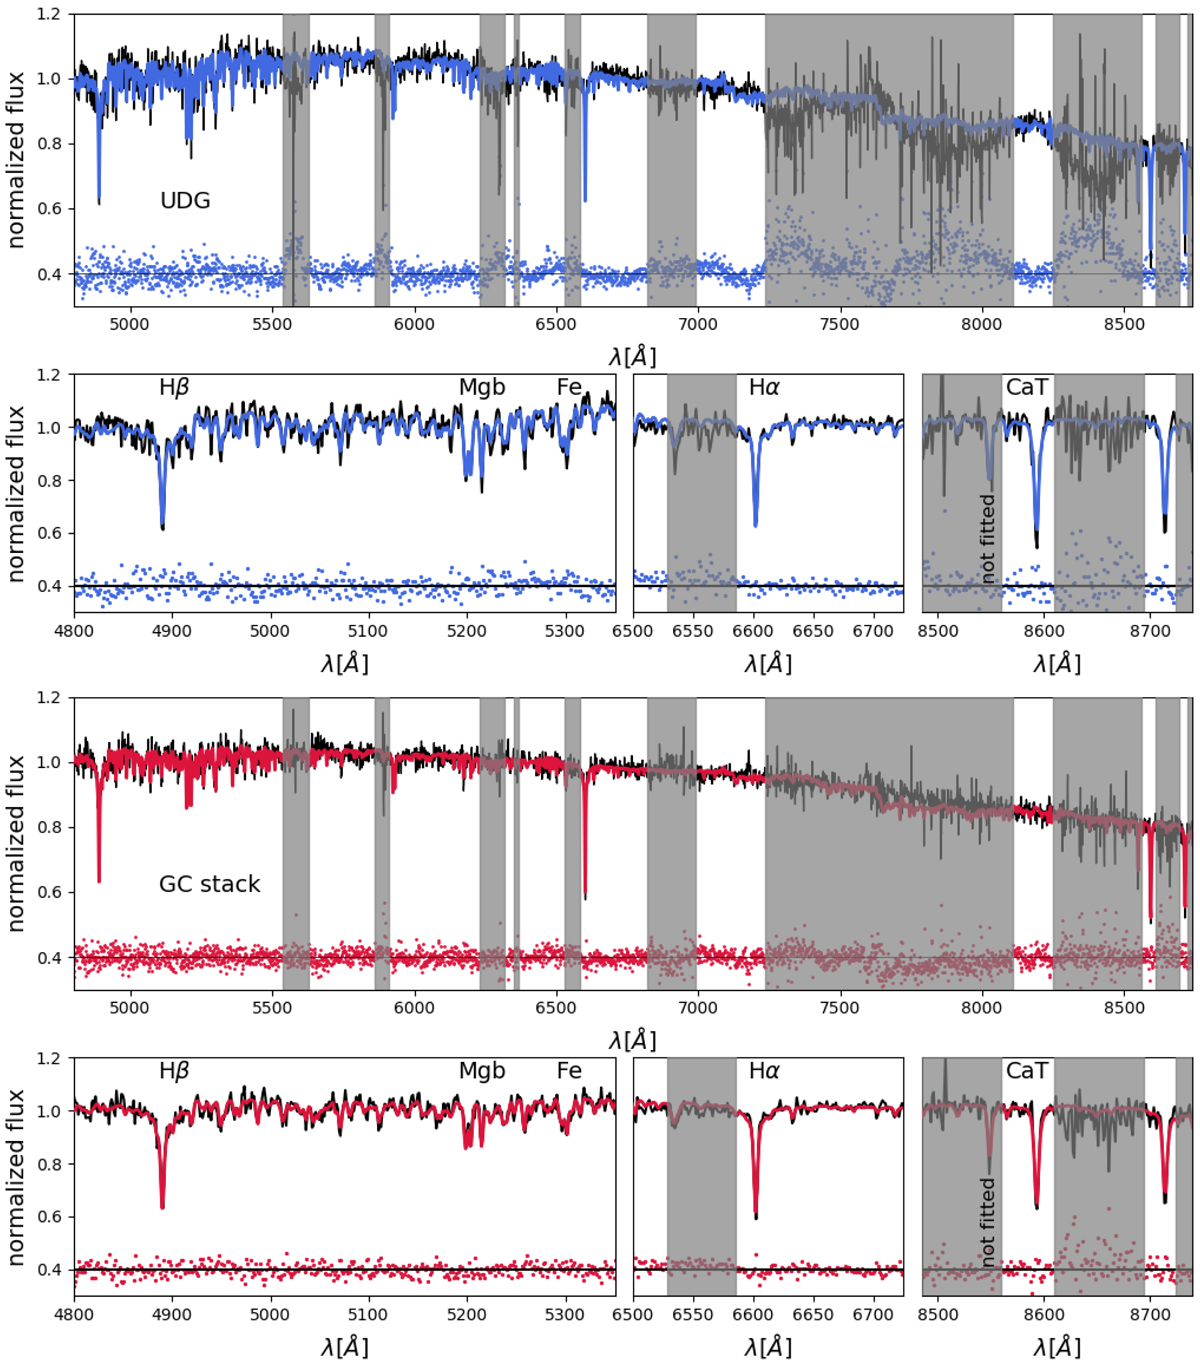
Comparison between the spectrum and the best fit from pPXF for the UDG and the GC stack spectra. The three plots in the bottom part of each panel show zooms on the important absorption lines. The gray regions are not taken into account for the fit. The scatter points show the residuals.
Current usage metrics show cumulative count of Article Views (full-text article views including HTML views, PDF and ePub downloads, according to the available data) and Abstracts Views on Vision4Press platform.
Data correspond to usage on the plateform after 2015. The current usage metrics is available 48-96 hours after online publication and is updated daily on week days.
Initial download of the metrics may take a while.