Fig. 8.
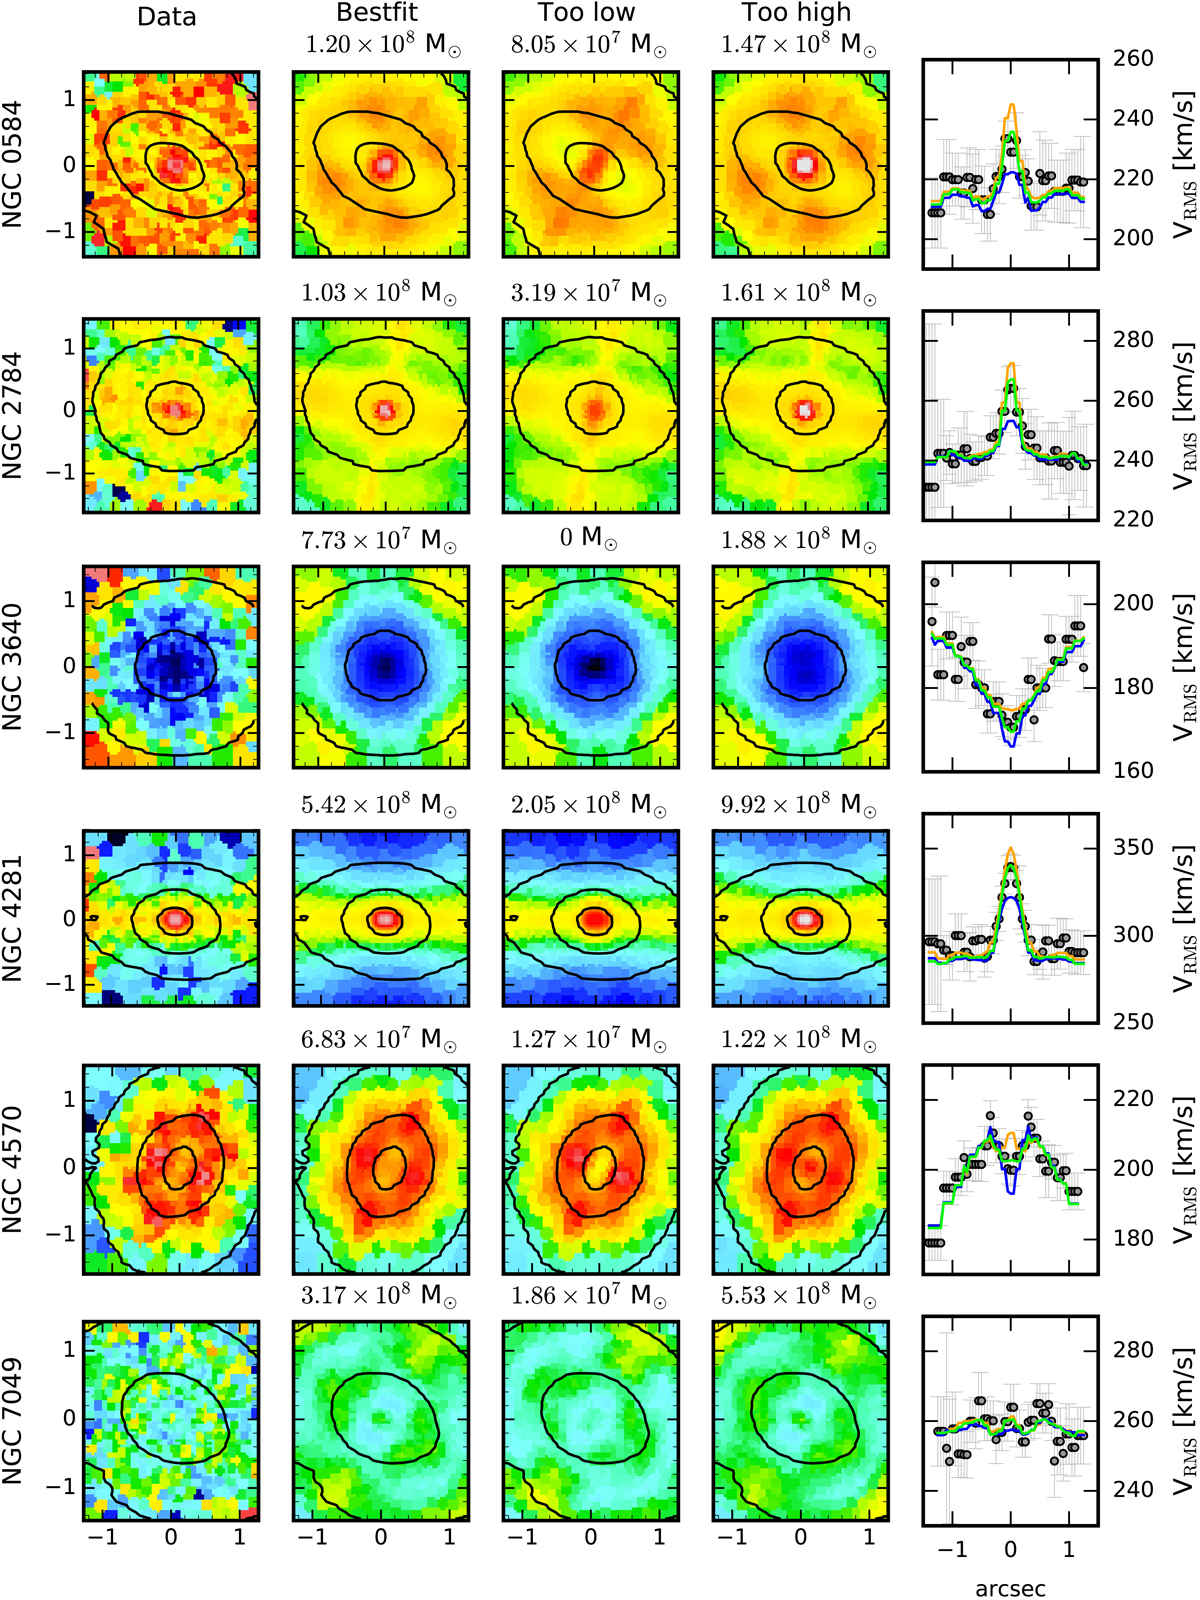
Comparison of the ![]() maps from the SINFONI data and the Schwarzschild models. Each row shows the maps of one galaxy, respectively. From left to right we present the observed symmetrized Vrms from the SINFONI data, and the Vrms maps of the Schwarzschild models from the best fitting, a too low and a too high MBH as well as the profiles along the x = 0 axis. The too low (blue) and too high (orange) black hole masses are chosen to be just outside of the 3σχ2 contours. All models are shown at the respective best-fitting M/L. The high- and low-mass models are clearly ruled out for all galaxies.
maps from the SINFONI data and the Schwarzschild models. Each row shows the maps of one galaxy, respectively. From left to right we present the observed symmetrized Vrms from the SINFONI data, and the Vrms maps of the Schwarzschild models from the best fitting, a too low and a too high MBH as well as the profiles along the x = 0 axis. The too low (blue) and too high (orange) black hole masses are chosen to be just outside of the 3σχ2 contours. All models are shown at the respective best-fitting M/L. The high- and low-mass models are clearly ruled out for all galaxies.
Current usage metrics show cumulative count of Article Views (full-text article views including HTML views, PDF and ePub downloads, according to the available data) and Abstracts Views on Vision4Press platform.
Data correspond to usage on the plateform after 2015. The current usage metrics is available 48-96 hours after online publication and is updated daily on week days.
Initial download of the metrics may take a while.