Fig. 7.
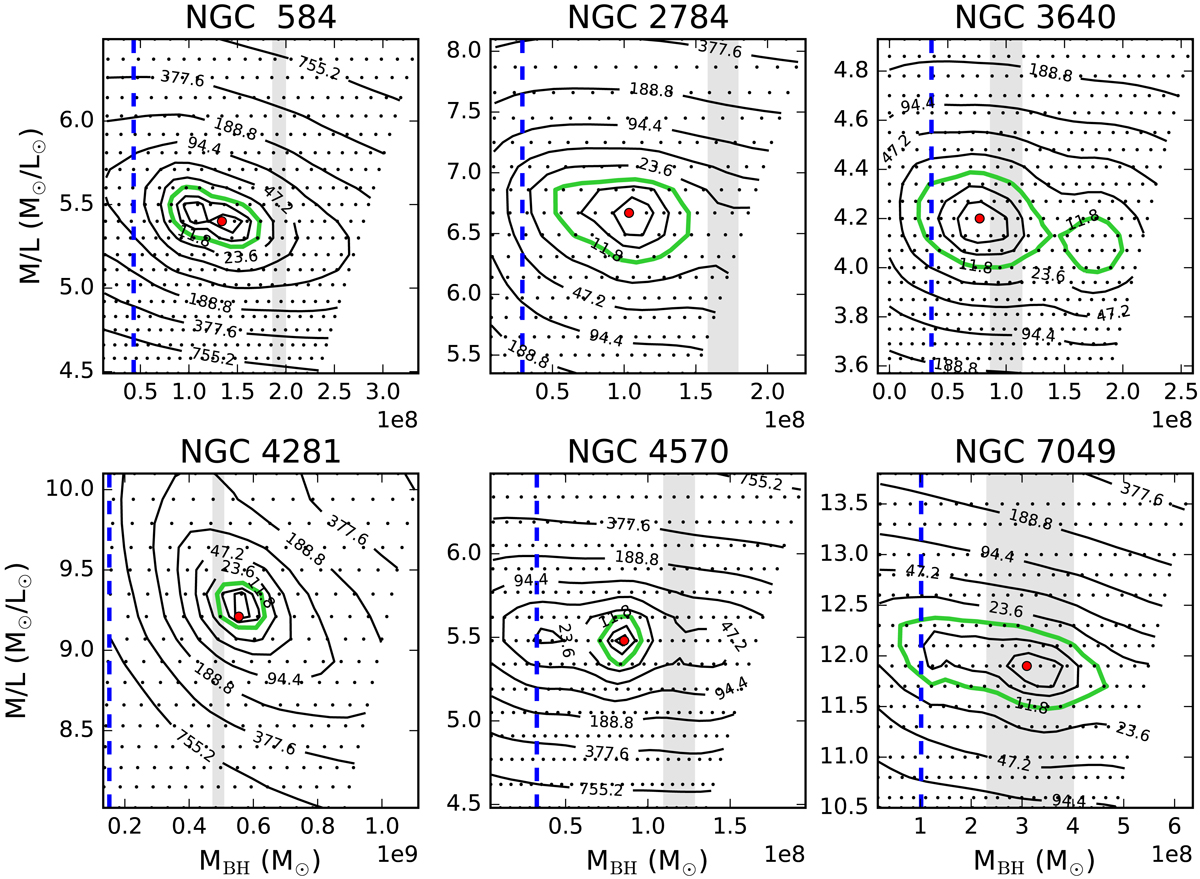
Grids of Schwarzschild models (indicated by the black dots) over various M/Ls and black hole masses MBH. The best-fitting model, derived as the minimum of χ2, is indicated by a large red circle. The contours indicate the ![]() levels; the thick green contour shows the 3σ level of the two-dimensional distribution. In addition, we added the 3σ limits on the best-fitting black hole masses of the JAM models (gray shaded regions). The dashed blue line indicates the mass of the black hole which has the radius of the SoI of half the resolution of our LGS AO data (inferred from the narrow component of the AO PSF); this is approximately the lowest black hole measurement that we expect to be detectable based on our data.
levels; the thick green contour shows the 3σ level of the two-dimensional distribution. In addition, we added the 3σ limits on the best-fitting black hole masses of the JAM models (gray shaded regions). The dashed blue line indicates the mass of the black hole which has the radius of the SoI of half the resolution of our LGS AO data (inferred from the narrow component of the AO PSF); this is approximately the lowest black hole measurement that we expect to be detectable based on our data.
Current usage metrics show cumulative count of Article Views (full-text article views including HTML views, PDF and ePub downloads, according to the available data) and Abstracts Views on Vision4Press platform.
Data correspond to usage on the plateform after 2015. The current usage metrics is available 48-96 hours after online publication and is updated daily on week days.
Initial download of the metrics may take a while.