Fig. 4.
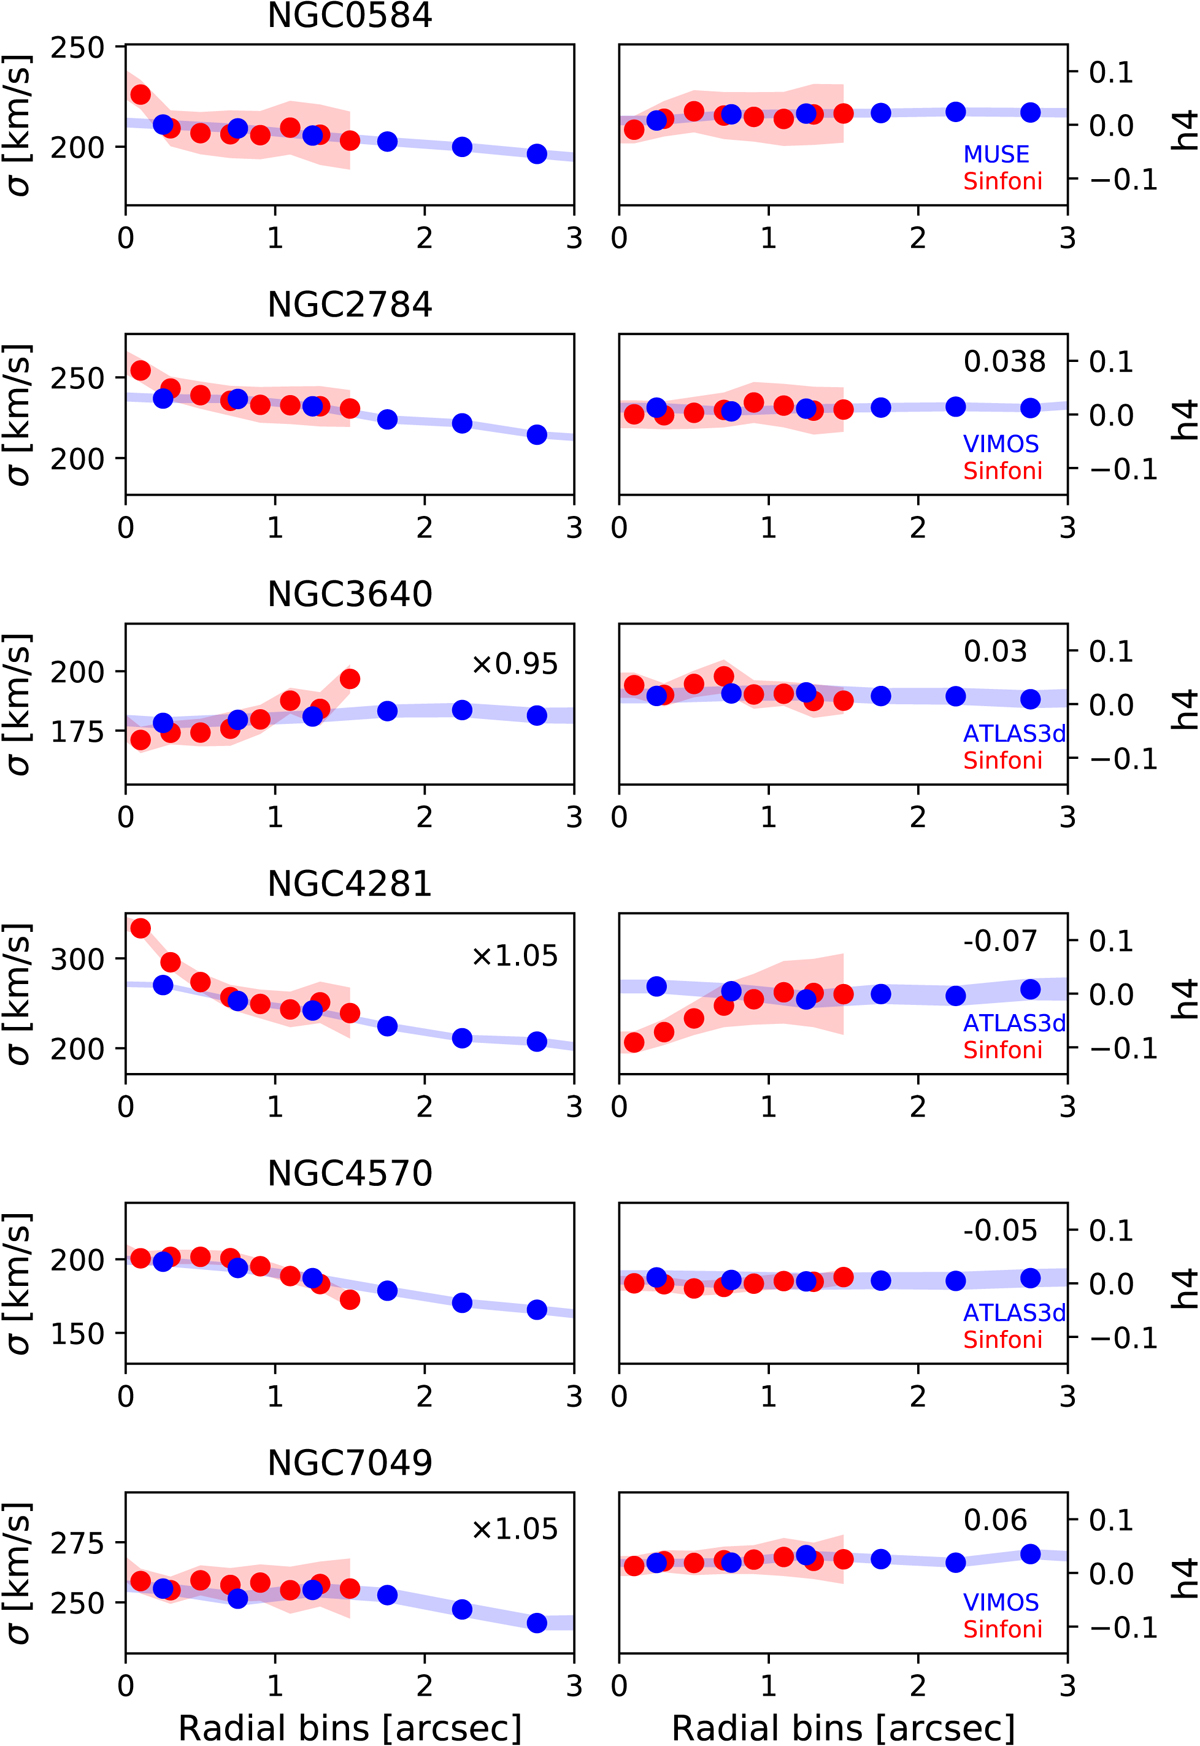
Comparison of velocity dispersion and h4 profiles for the SINFONI (red) and the respective large-scale data (blue). The values were averaged within circular annuli around the kinematic center. The error range of the averaged values in the radial bins are calculated via error propagation and are shown as shaded regions. Applied shifts in the SINFONI maps are denoted by the values in the upper right corner of each panel.
Current usage metrics show cumulative count of Article Views (full-text article views including HTML views, PDF and ePub downloads, according to the available data) and Abstracts Views on Vision4Press platform.
Data correspond to usage on the plateform after 2015. The current usage metrics is available 48-96 hours after online publication and is updated daily on week days.
Initial download of the metrics may take a while.