Fig. B.1.
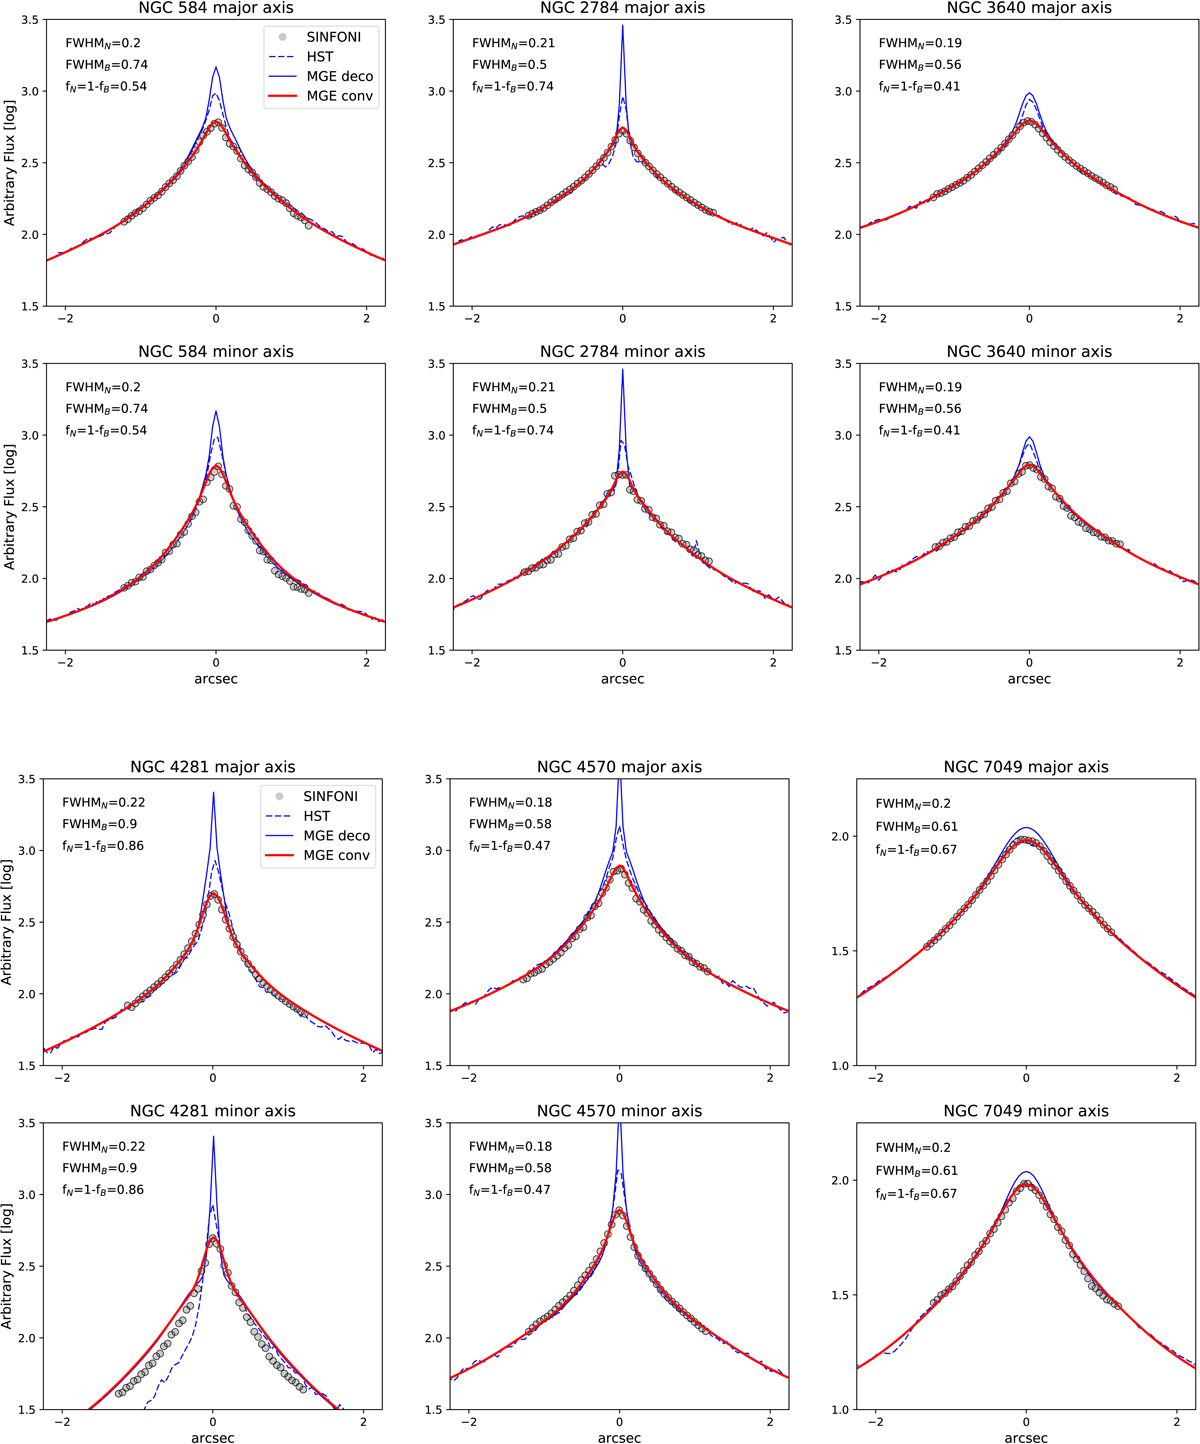
Determination of the SINFONI AO spatial resolution by comparing the surface brightness from the SINFONI reconstructed images with the respective convolved MGE models. Shown are the surface brightness profiles along the galaxy semimajor (top panel) and minor axis (bottom panel) of the SINFONI IFU image (red circles), deconvolved MGE model (green dashed line), convolved MGE model (black solid line), and HST image (blue dashed line) used to create the MGE model. The light profiles of NGC 2784, NGC 4281, and NGC 7049 show clear signatures of nuclear dust. Before comparing the profiles, all images were rotated such that the major and minor axis would match the vertical and horizontal image axis. The parameters of the double Gaussians used to describe the SINFONI PSFs are given in the upper left corner.
Current usage metrics show cumulative count of Article Views (full-text article views including HTML views, PDF and ePub downloads, according to the available data) and Abstracts Views on Vision4Press platform.
Data correspond to usage on the plateform after 2015. The current usage metrics is available 48-96 hours after online publication and is updated daily on week days.
Initial download of the metrics may take a while.