Fig. 7.
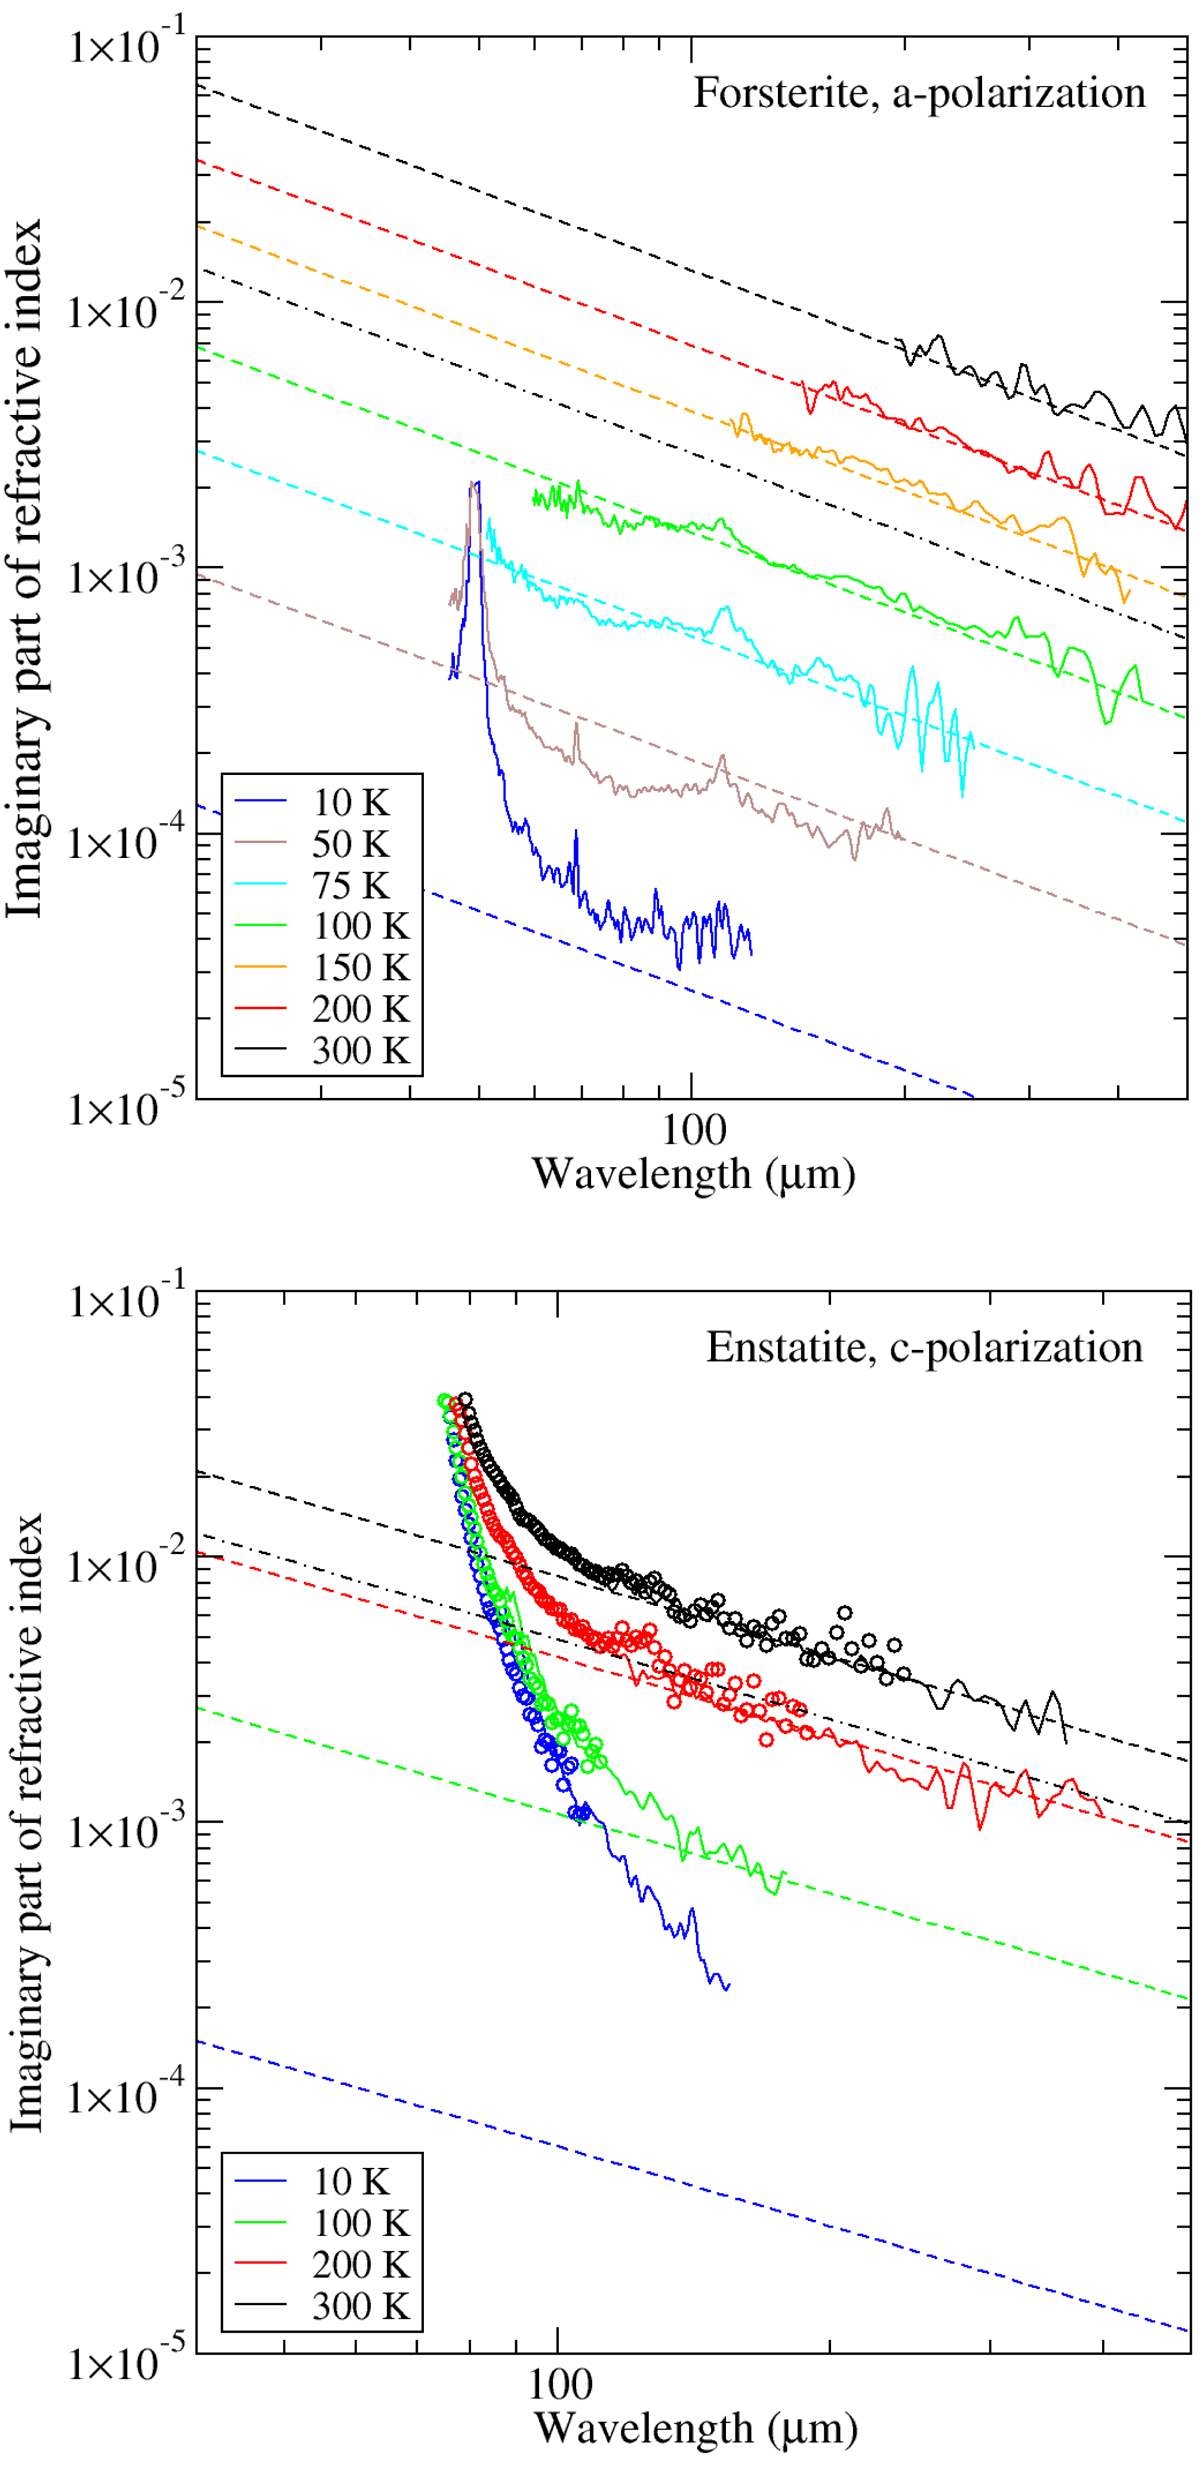
Spectra of the imaginary part of the refractive index (lower limit values) for forsterite in a-polarization (solid lines, upper panel) and enstatite in c-polarization (circles and solid lines, lower panel) compared to the best-fit continuum absorption model (see also Fig. 6). The dashed lines represent the full model (single-phonon plus phonon difference-process contributions); the dash-dotted lines are the single-phonon components alone for θ = 300 K.
Current usage metrics show cumulative count of Article Views (full-text article views including HTML views, PDF and ePub downloads, according to the available data) and Abstracts Views on Vision4Press platform.
Data correspond to usage on the plateform after 2015. The current usage metrics is available 48-96 hours after online publication and is updated daily on week days.
Initial download of the metrics may take a while.