Fig. 6.
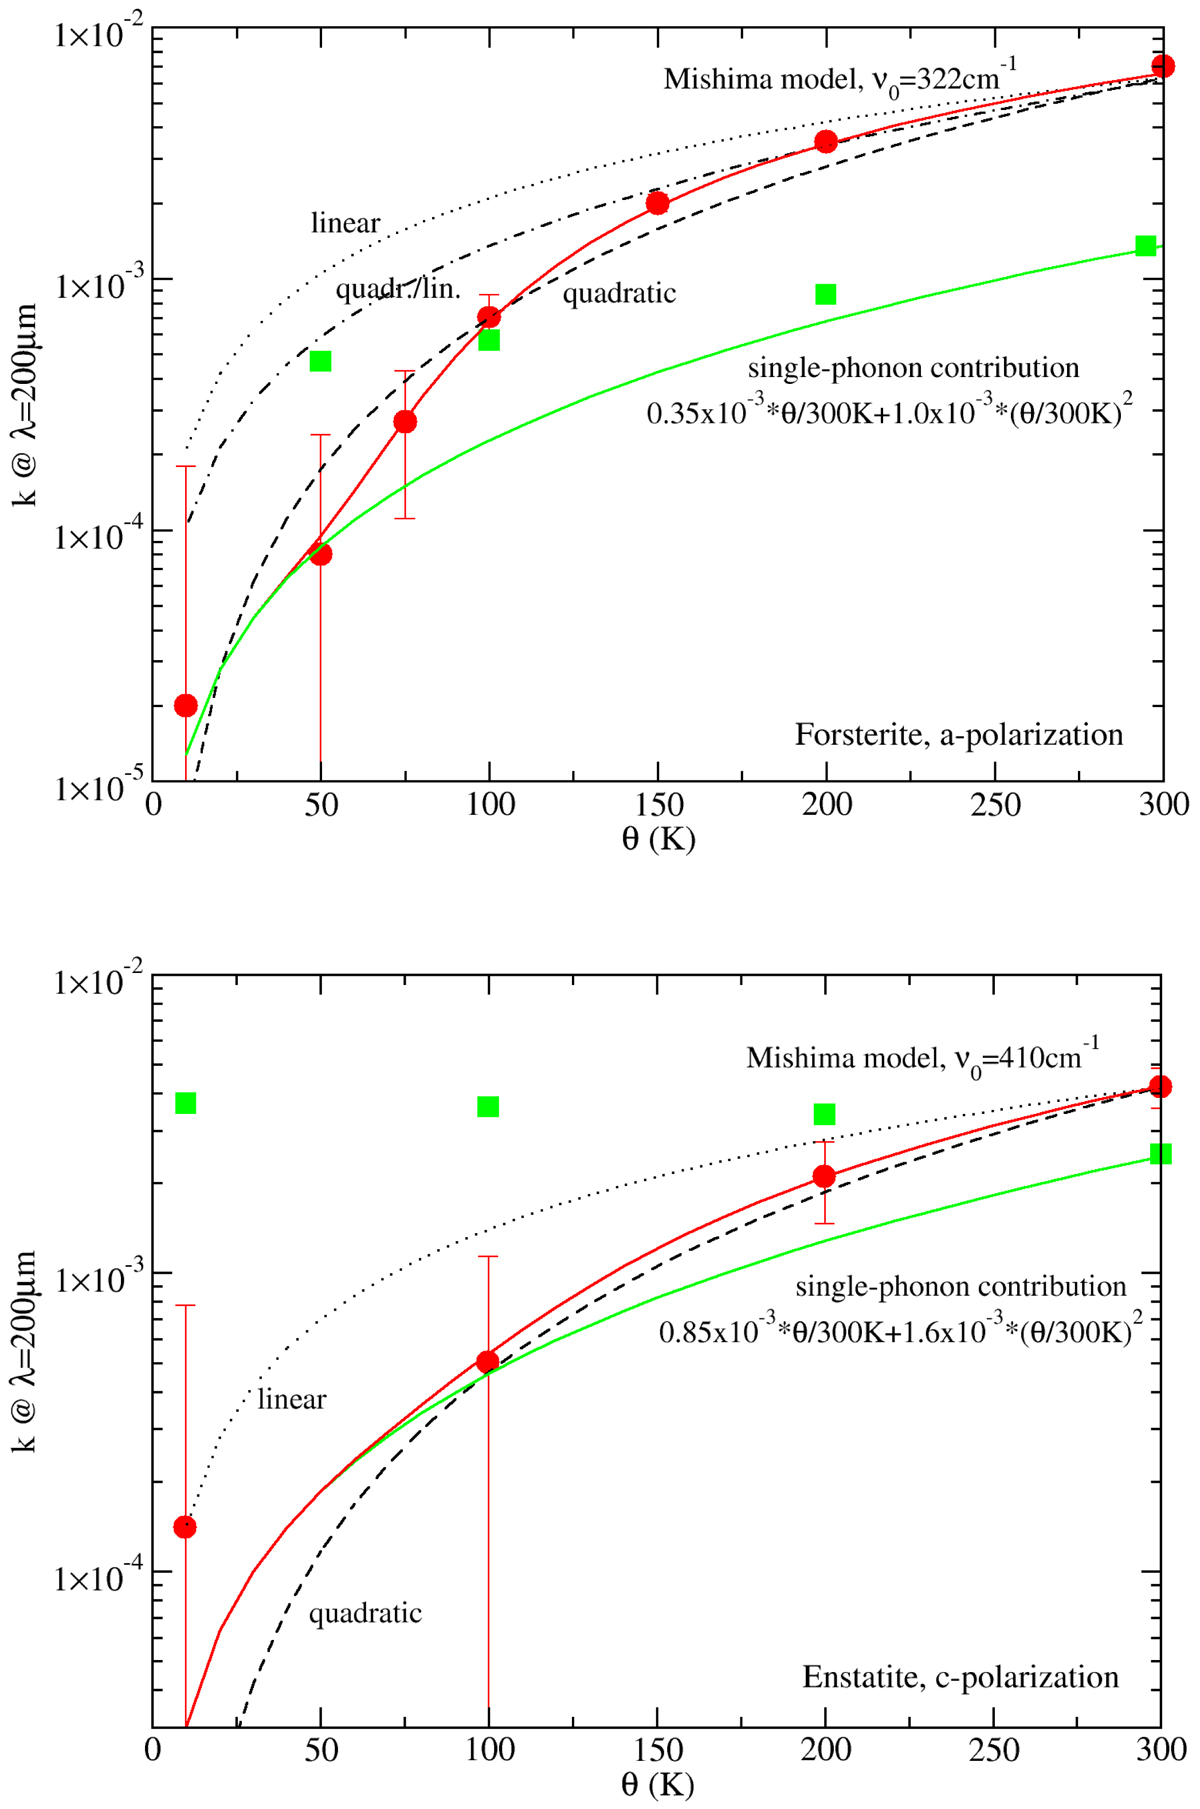
Temperature dependence of the imaginary part of the refractive index for forsterite in a-polarization (upper panel) and enstatite in c-polarization (lower panel) at λ = 200 μm (lower limit values; red dots with error bars). The oscillator-model data are represented by the green filled squares. The red solid lines represent model curves built from the contributions of phonon difference processes (Mishima model) plus the contributions of single-phonon absorption; the green solid line is the single-phonon contribution alone. Also shown are simple linear, quadratic, and mixed linear/quadratic curves (black dotted, dashed, and dash-dotted lines) in order to check their compatibility with the measured data (see text).
Current usage metrics show cumulative count of Article Views (full-text article views including HTML views, PDF and ePub downloads, according to the available data) and Abstracts Views on Vision4Press platform.
Data correspond to usage on the plateform after 2015. The current usage metrics is available 48-96 hours after online publication and is updated daily on week days.
Initial download of the metrics may take a while.