Fig. 5.
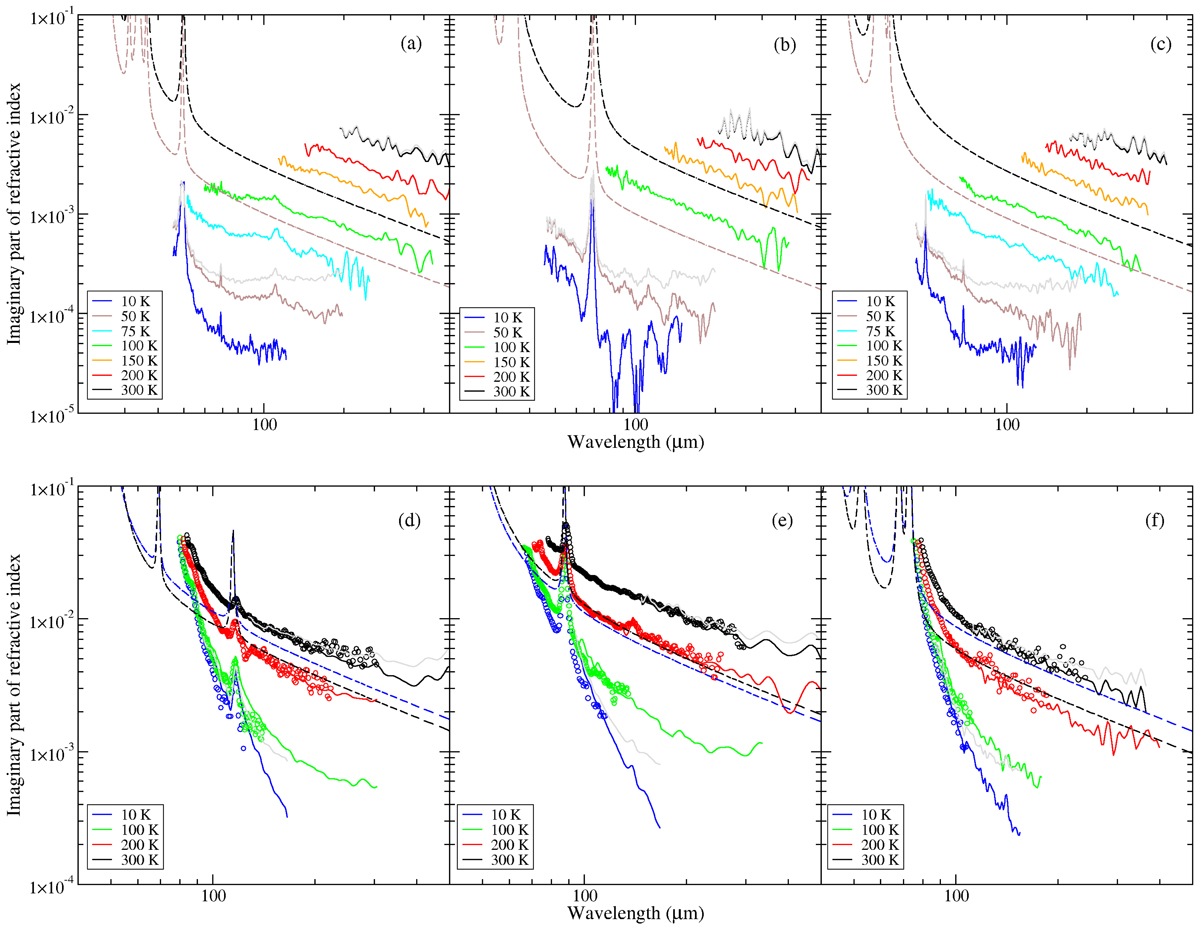
Imaginary part of the refractive index for forsterite (upper panels) and enstatite (lower panels) in the three polarization directions: a-polarization (left), b-polarization (middle), c-polarization (right). Lower limit spectra are plotted as symbols and solid lines in colors and upper limit spectra in gray (for selected temperatures). The measured data are compared with literature data derived from reflection spectroscopy by Suto et al. (2006) for forsterite (dashed lines, 50 K and 300 K) and Zeidler et al. (2015) for enstatite (10 K and 300 K, with an extension using data from Demichelis et al. 2012, as described in the text).
Current usage metrics show cumulative count of Article Views (full-text article views including HTML views, PDF and ePub downloads, according to the available data) and Abstracts Views on Vision4Press platform.
Data correspond to usage on the plateform after 2015. The current usage metrics is available 48-96 hours after online publication and is updated daily on week days.
Initial download of the metrics may take a while.