Fig. 4.
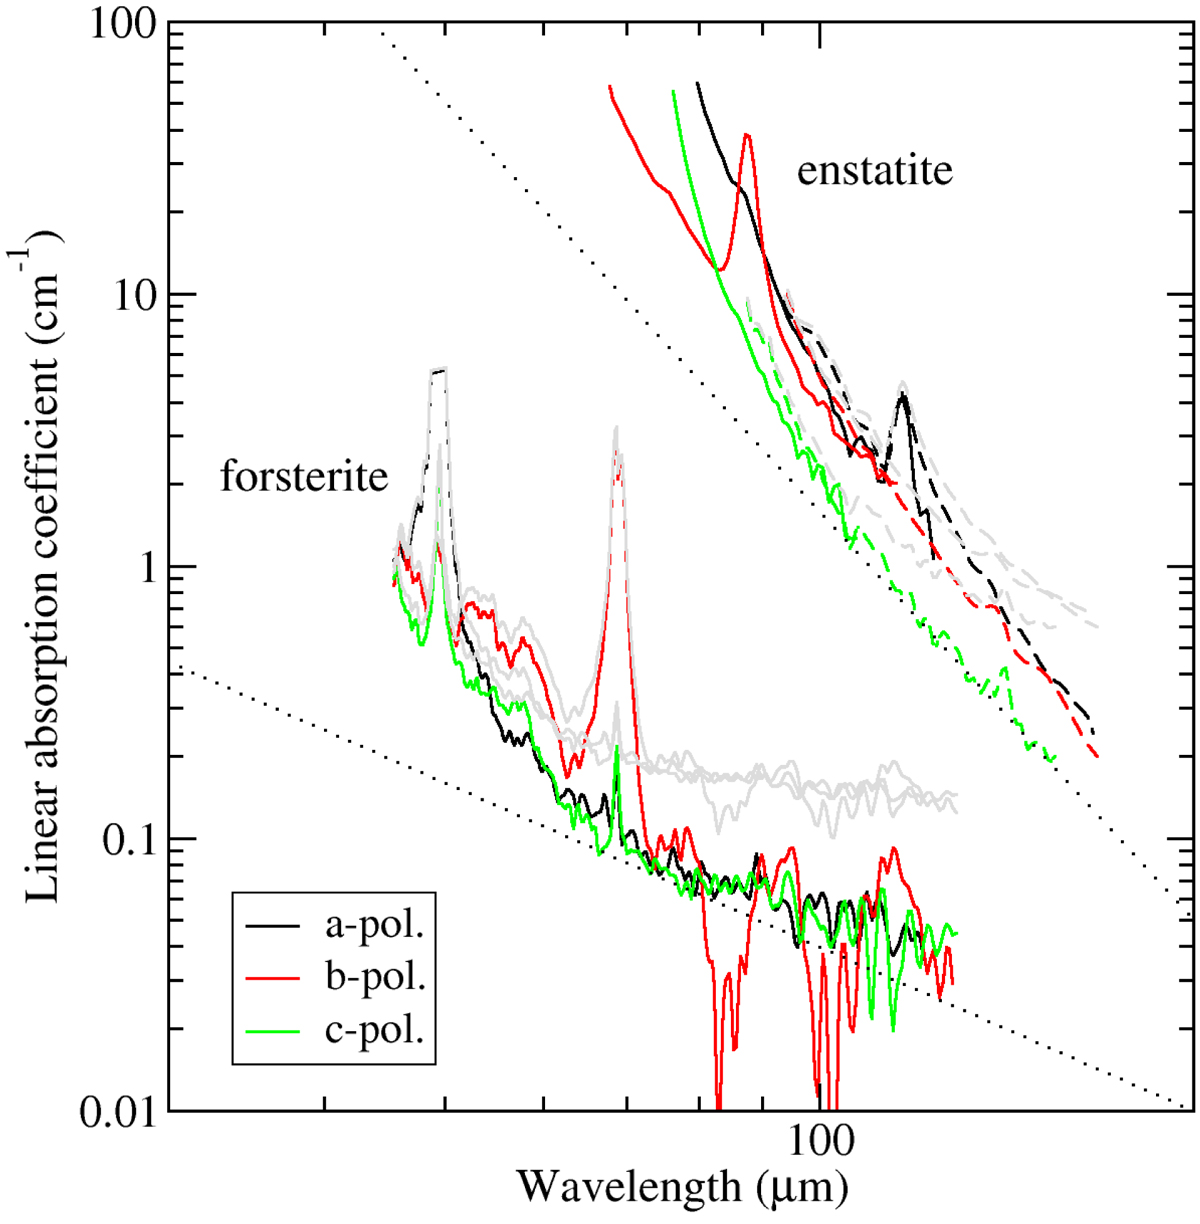
Lower and upper limit absorption coefficient spectra at a temperature of 10 K in the three polarization directions. The dashed lines correspond to the spectra of the thick enstatite samples (enstatite Burma). For clarity, the upper limit spectra for the thin enstatite samples are not shown. The lower and upper black dotted lines indicate λ−2 and λ−5 spectral slopes, respectively.
Current usage metrics show cumulative count of Article Views (full-text article views including HTML views, PDF and ePub downloads, according to the available data) and Abstracts Views on Vision4Press platform.
Data correspond to usage on the plateform after 2015. The current usage metrics is available 48-96 hours after online publication and is updated daily on week days.
Initial download of the metrics may take a while.