Fig. 3.
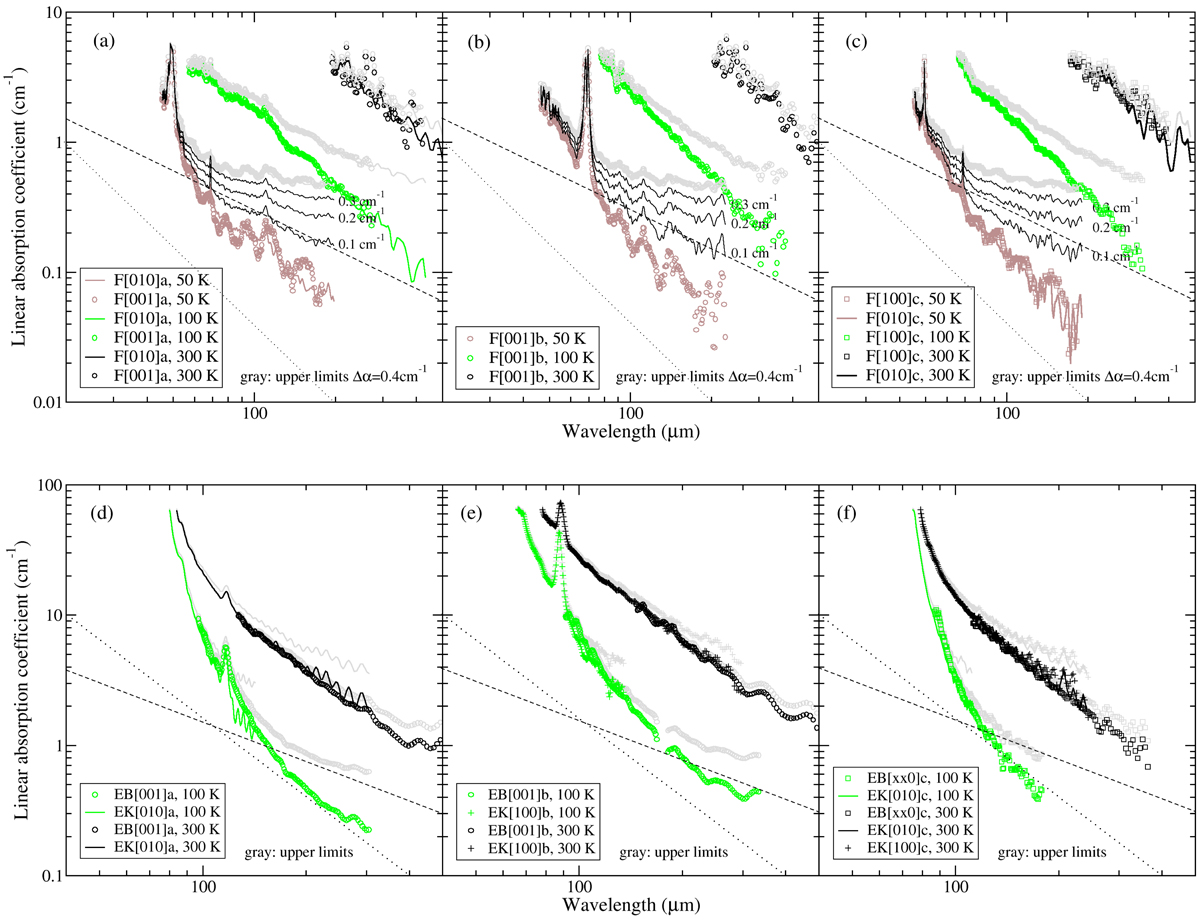
Lower and upper limits (αll and αul = αll + Δα) of the linear absorption coefficient for forsterite (upper panels) and enstatite (lower panels) in the three polarization directions: a-polarization (left), b-polarization (middle), and c-polarization (right). The data resulting from sample F[100] and EB[xx0] are plotted as squares, F[010] and EK[010] as solid lines, F[001] and EB[001] as circles, EK[100] as plus symbols. Lower limits are plotted in color, upper limits with Δα according to Table 1 are plotted in gray. Spectra calculated for 100 K forsterite with reduced Δα = 0.1, 0.2, and 0.3 cm−1 are shown as thin black lines, labeled with the Δα values. For clarity, the spectra are only shown for selected temperatures, as indicated in the legends. The dashed and dotted straight lines indicate power laws proportional to 1/λ and 1/λ2, respectively. The wavelength scales in the upper and lower panels are not the same.
Current usage metrics show cumulative count of Article Views (full-text article views including HTML views, PDF and ePub downloads, according to the available data) and Abstracts Views on Vision4Press platform.
Data correspond to usage on the plateform after 2015. The current usage metrics is available 48-96 hours after online publication and is updated daily on week days.
Initial download of the metrics may take a while.