Fig. 1.
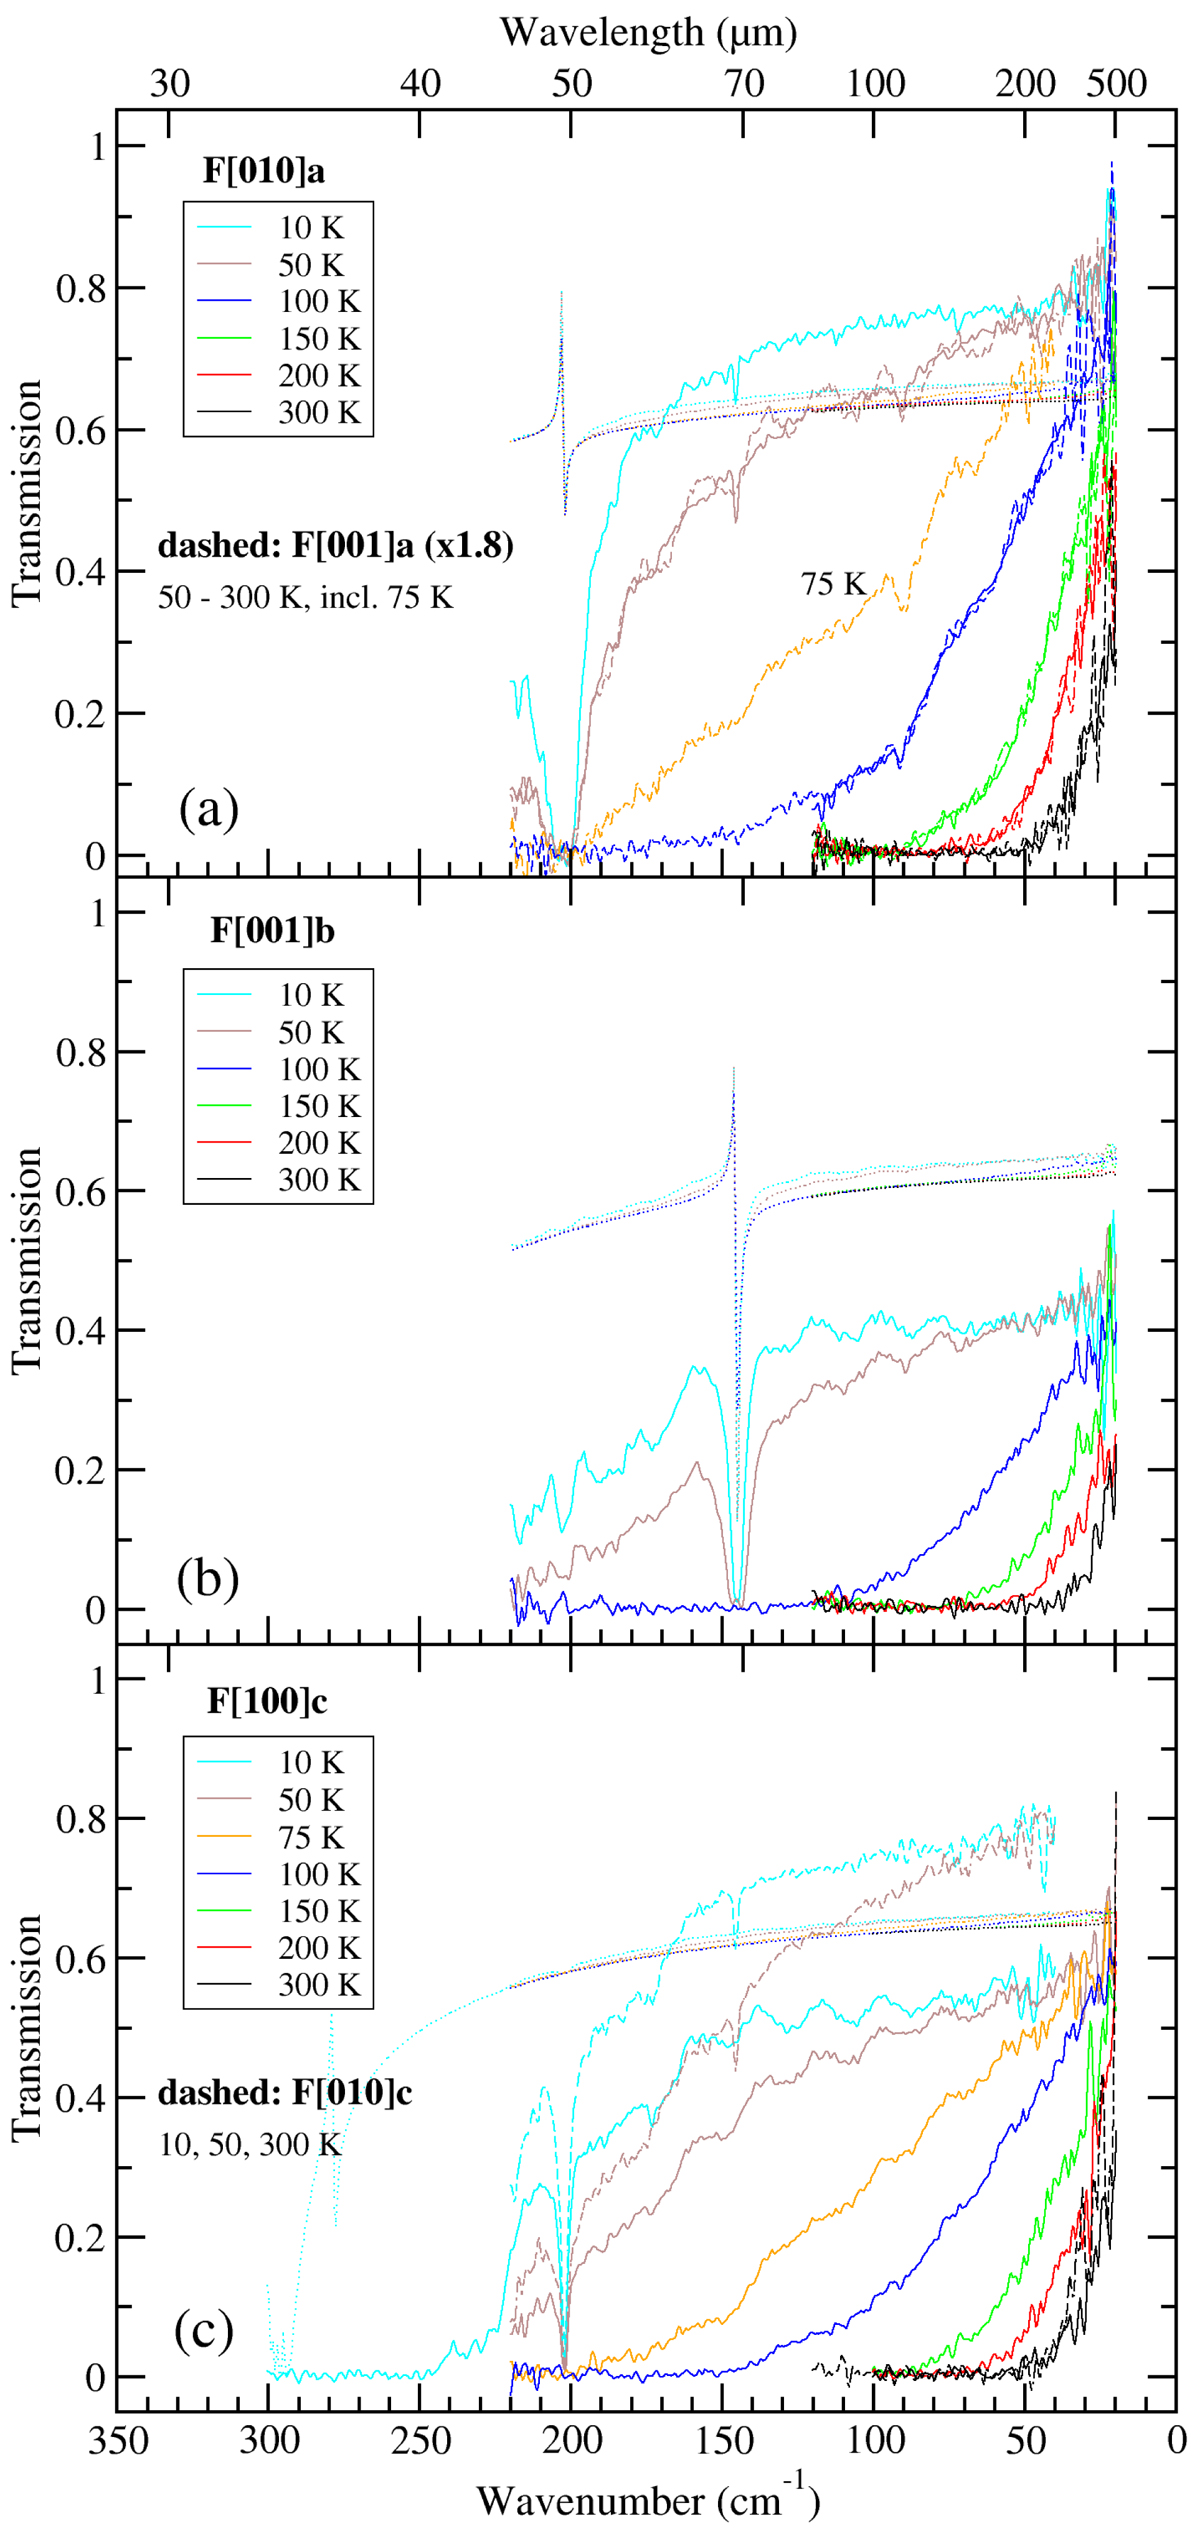
Temperature-dependent transmission spectra of the forsterite crystal for orientation of the electric field parallel to the a-axis (panel a), b-axis (panel b), and c-axis (panel c). Complete temperature series (F[010]a, F[001]b, F[100]c) are plotted as solid lines, the two incomplete series as dashed lines. The F[001]a curves have been scaled by a factor of 1.8; they approximately match the F[010]a curves for the same temperatures. Dotted lines: calculated maximum transmission curves taking into account the intensity reflected by the crystal surfaces.
Current usage metrics show cumulative count of Article Views (full-text article views including HTML views, PDF and ePub downloads, according to the available data) and Abstracts Views on Vision4Press platform.
Data correspond to usage on the plateform after 2015. The current usage metrics is available 48-96 hours after online publication and is updated daily on week days.
Initial download of the metrics may take a while.