Fig. 2.
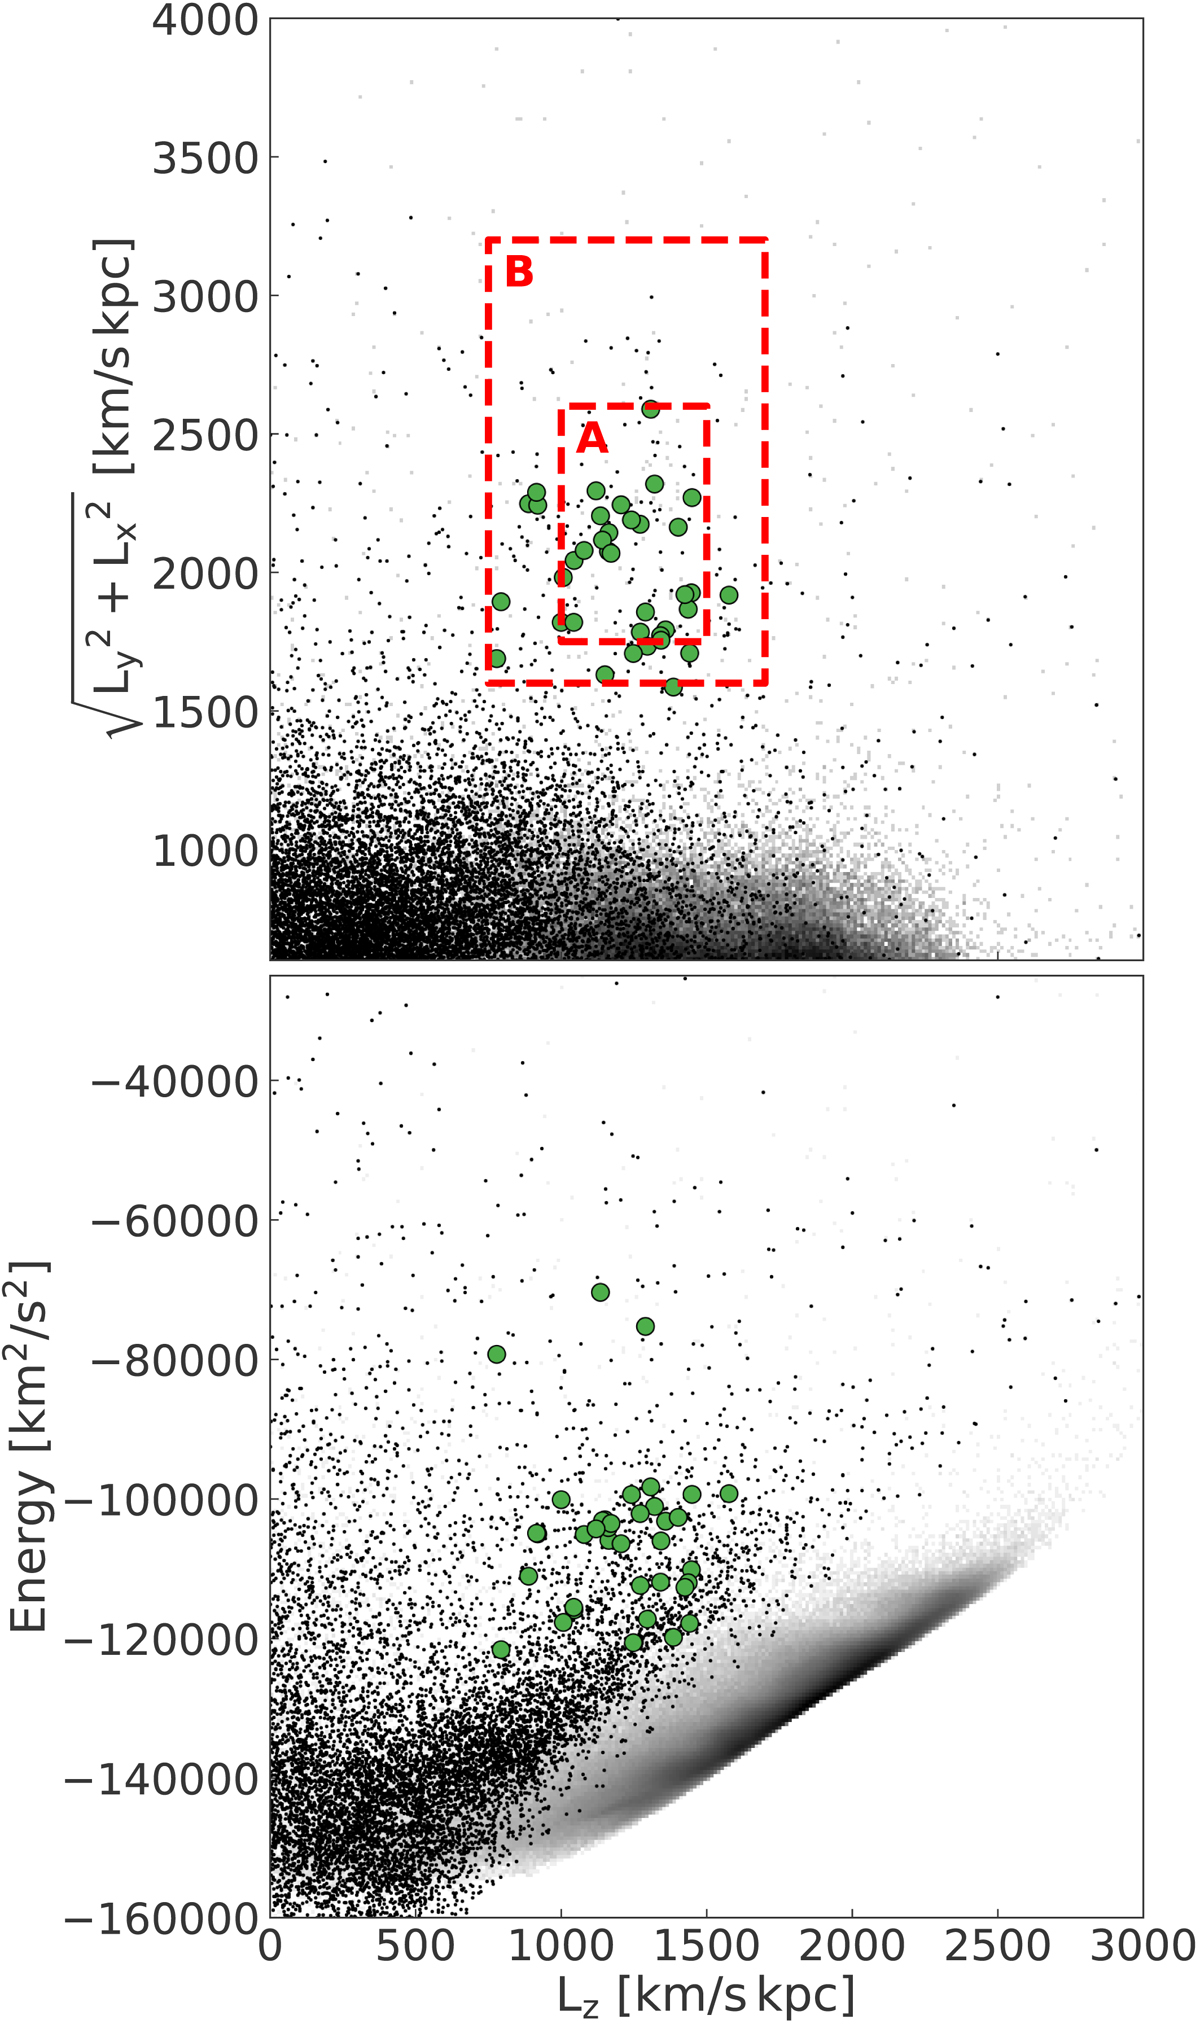
Distribution of angular momentum L⊥ and Lz (top panel) energy E and Lz (bottom panel). The black dots show all of the stars of our sample of kinematically selected halo stars located within 2.5 kpc from the Sun. Core members from Sect. 3.1 of the Helmi streams are shown with green symbols to guide the reader’s eyes. With red, dashed lines we indicate the limits we apply to select additional members of the Helmi streams. In the background, the location of the disc(s) is shown with a grey density map.
Current usage metrics show cumulative count of Article Views (full-text article views including HTML views, PDF and ePub downloads, according to the available data) and Abstracts Views on Vision4Press platform.
Data correspond to usage on the plateform after 2015. The current usage metrics is available 48-96 hours after online publication and is updated daily on week days.
Initial download of the metrics may take a while.