Fig. A.1.
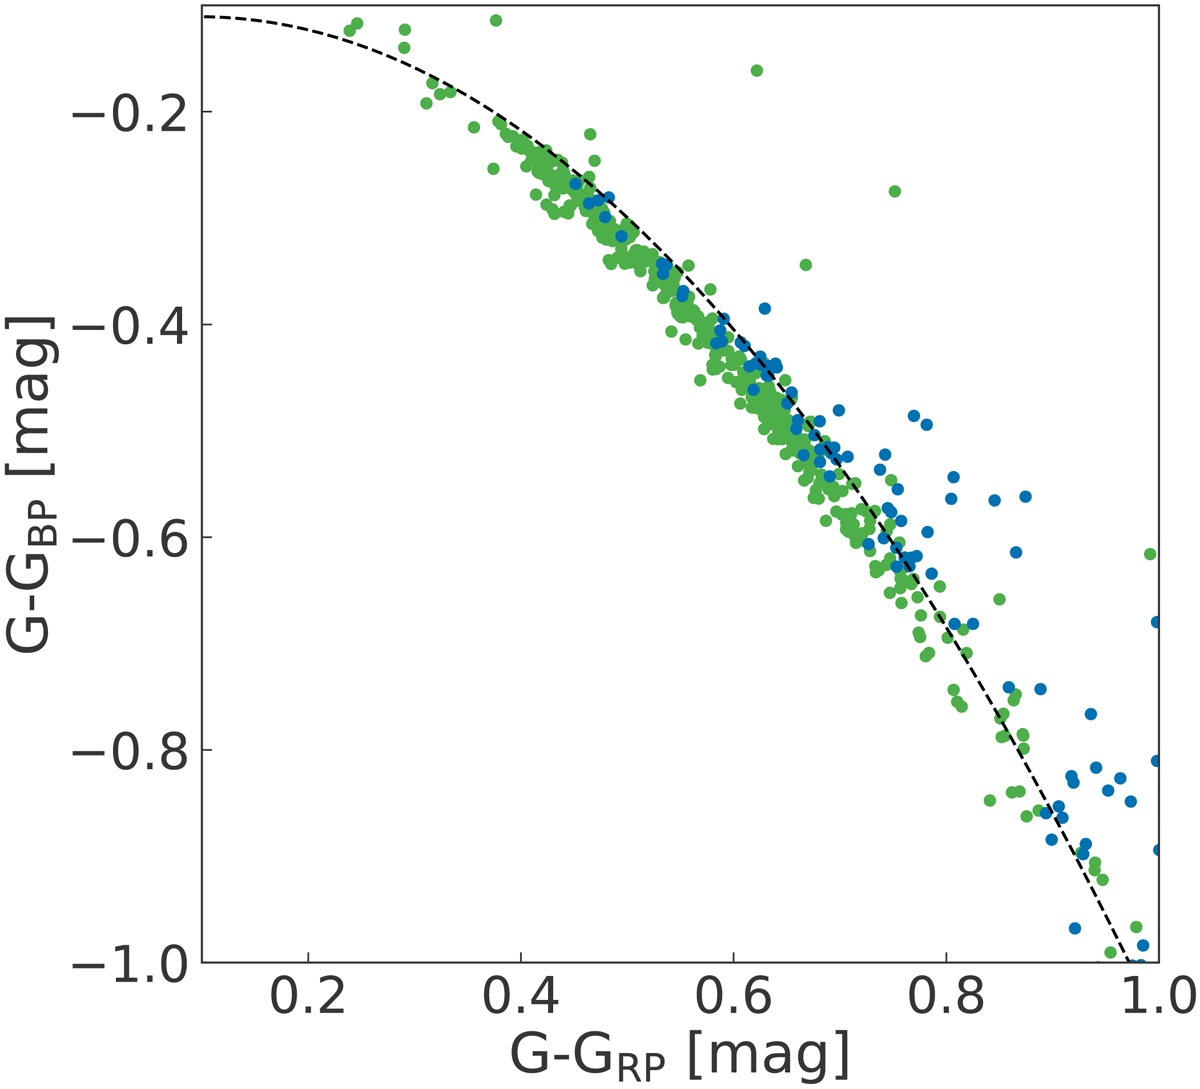
Colour-colour diagram used to identify sources that are likely affected by extinction. Sources that offset from the main population by more than 5× the mean error in the used colours, i.e. 0.017 in (G − GBP), are considered to be reddened. The main population is fit with a second-degree polynomial (dashed line). The dashed line is offset by 0.017 in (G − GBP) to indicate which sources are reddened, i.e. those above the line. The members identified in the full 6D sample are shown with green markers, those without radial velocities are blue.
Current usage metrics show cumulative count of Article Views (full-text article views including HTML views, PDF and ePub downloads, according to the available data) and Abstracts Views on Vision4Press platform.
Data correspond to usage on the plateform after 2015. The current usage metrics is available 48-96 hours after online publication and is updated daily on week days.
Initial download of the metrics may take a while.