Fig. 13.
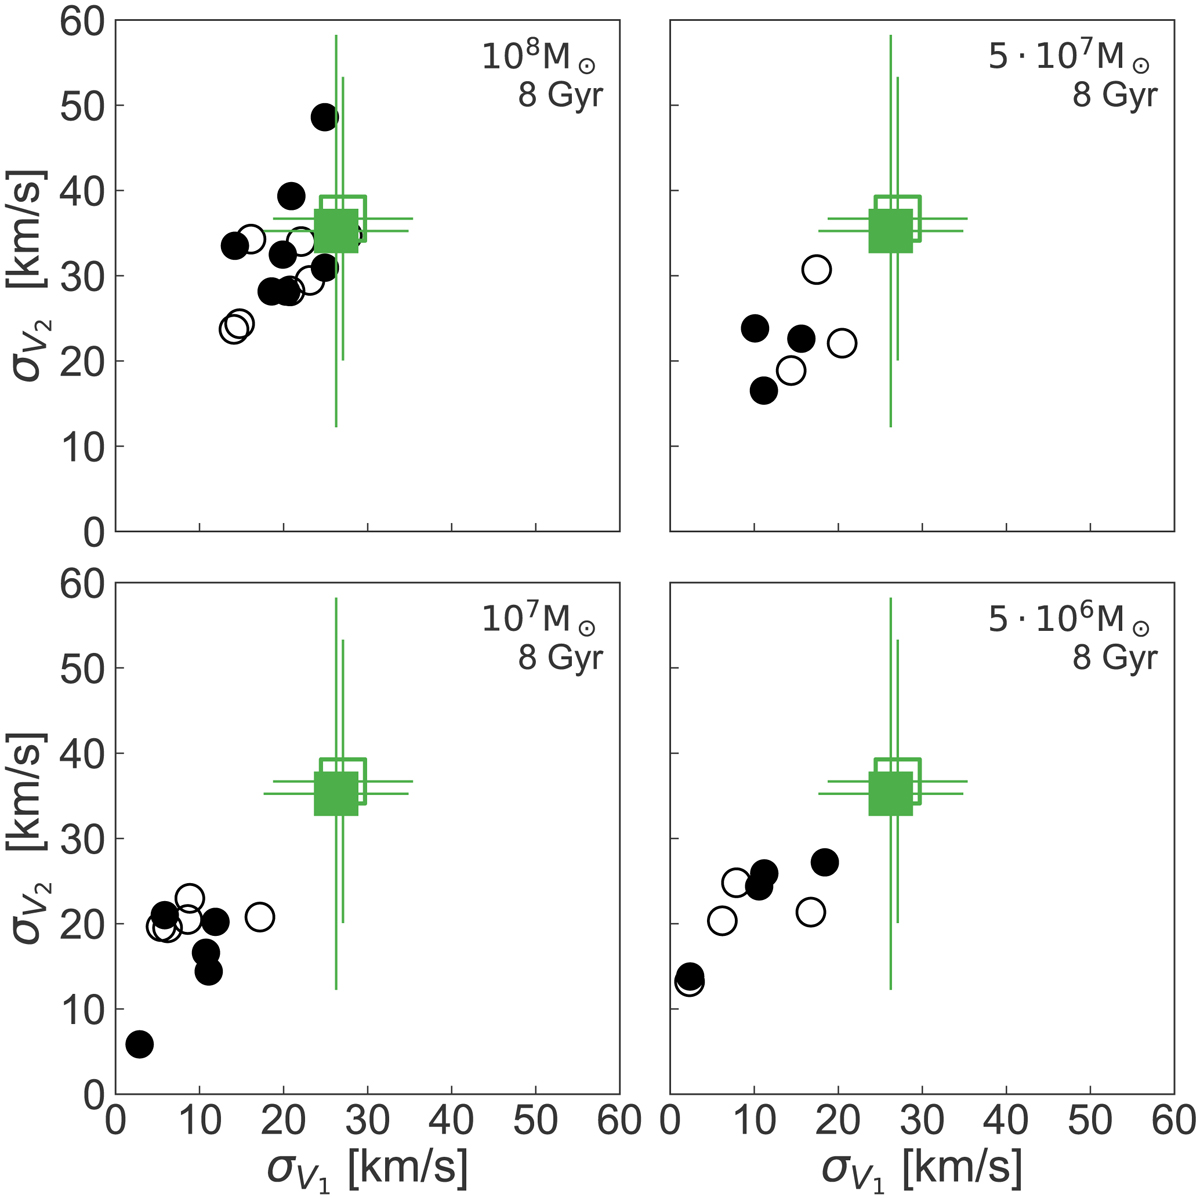
Velocity dispersions of the simulated streams 8 Gyr after accretion. These have been computed using the principal axis of the velocity ellipsoid of stars in a given VZ clump, open markers are used for the smallest clump and closed markers for the largest. We show the results for volumes satisfying the ratio in the number of stars in the clumps as observed for the data. The green markers indicate the measured velocity dispersion from the data, the error bars illustrate the scatter in 1000 randomly down sampled sets of the streams members. These measured dispersions are deconvolved of their errors, and a 1σ clip in VR is applied.
Current usage metrics show cumulative count of Article Views (full-text article views including HTML views, PDF and ePub downloads, according to the available data) and Abstracts Views on Vision4Press platform.
Data correspond to usage on the plateform after 2015. The current usage metrics is available 48-96 hours after online publication and is updated daily on week days.
Initial download of the metrics may take a while.