Free Access
Fig. 5.
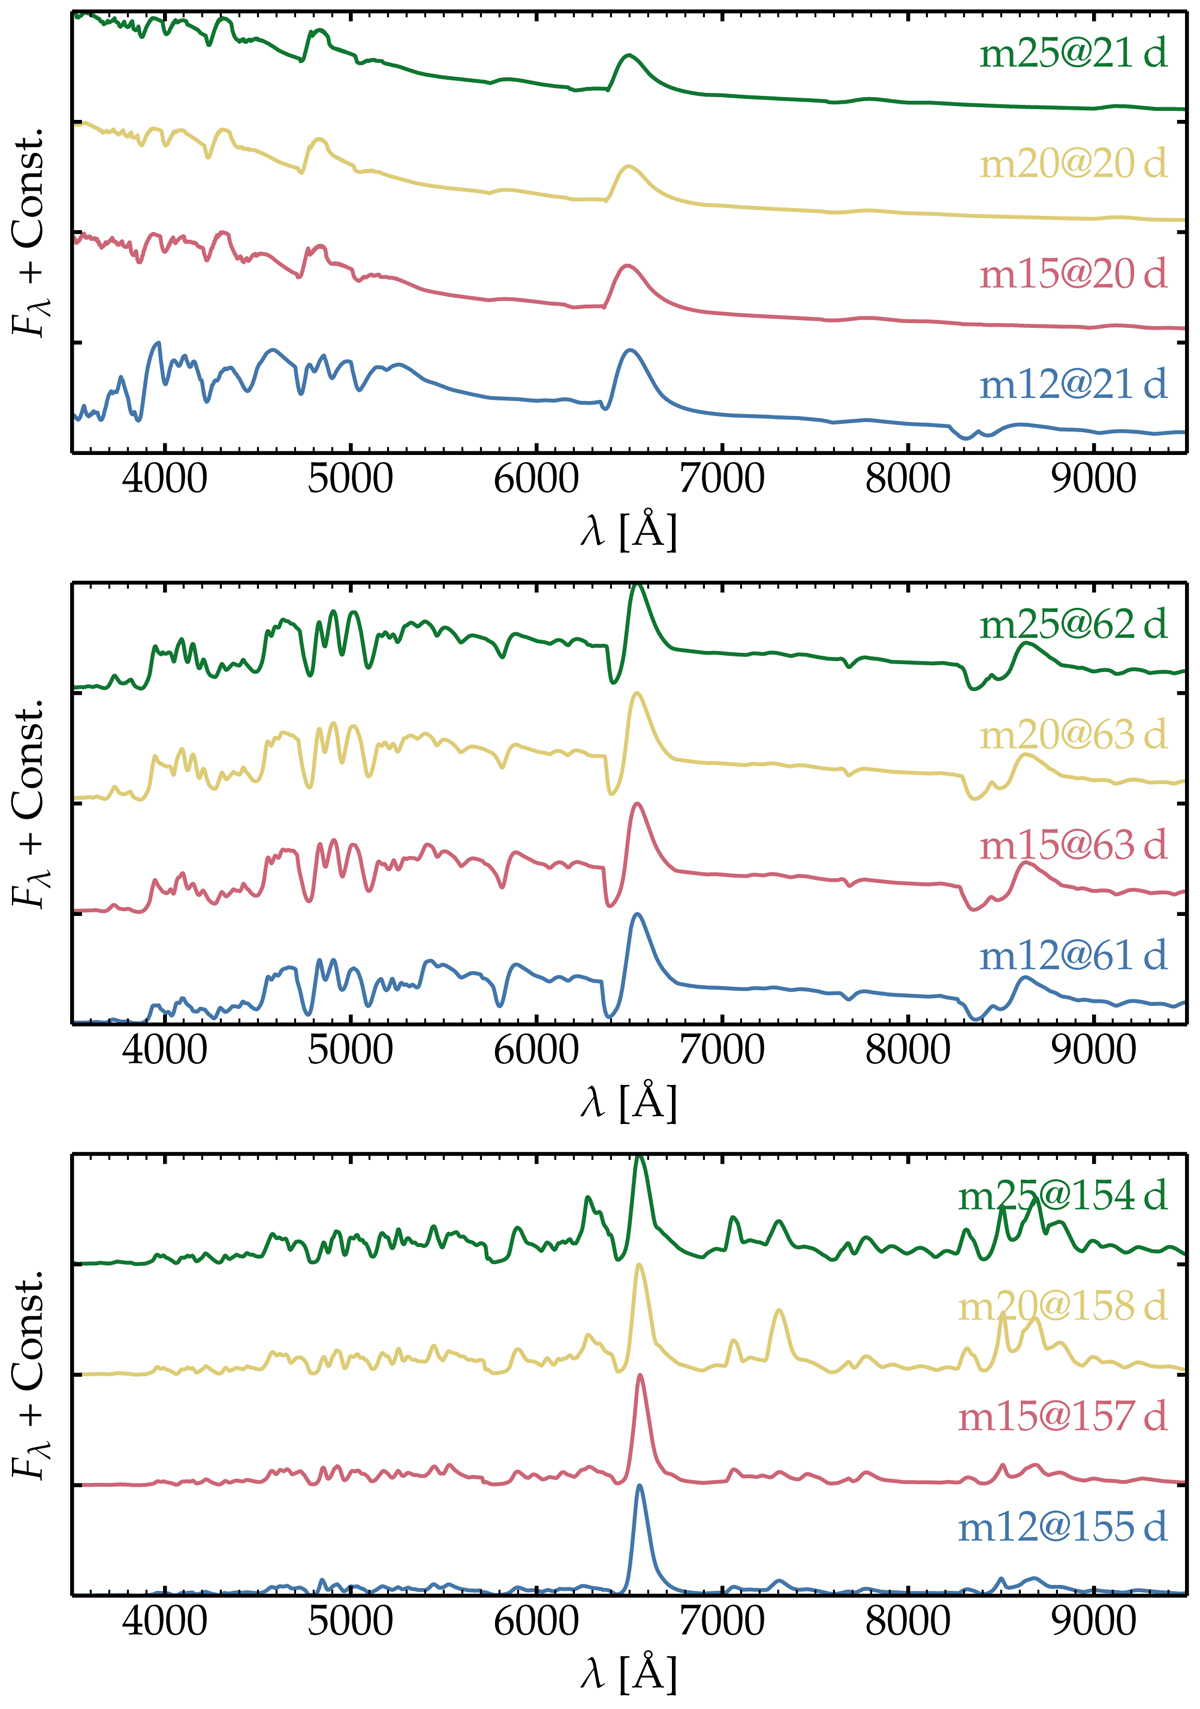
Comparison of optical spectra for models m12, m15, m20, and m25 at about 20 d (top), 62 d (middle), and 155 d (bottom) after explosion. The color offset at early times results from the different progenitor radii. The greater O I 6300 Å line in more massive progenitors arises from their greater oxygen content.
Current usage metrics show cumulative count of Article Views (full-text article views including HTML views, PDF and ePub downloads, according to the available data) and Abstracts Views on Vision4Press platform.
Data correspond to usage on the plateform after 2015. The current usage metrics is available 48-96 hours after online publication and is updated daily on week days.
Initial download of the metrics may take a while.